. 2002 Nov 12;99(23):15136-41.
doi: 10.1073/pnas.182558799. Epub 2002 Oct 31.

Cag pathogenicity island-specific responses of gastric epithelial cells to Helicobacter pylori infection

Affiliations

Cag pathogenicity island-specific responses of gastric epithelial cells to Helicobacter pylori infection

Karen Guillemin et al. Proc Natl Acad Sci U S A. .

Abstract

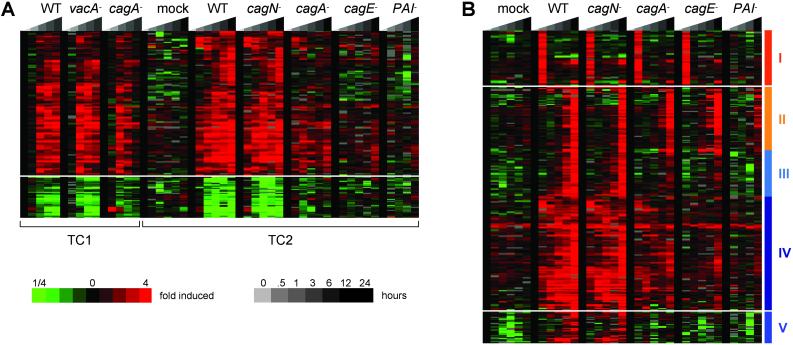
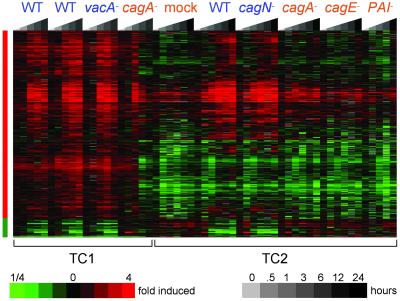
Helicobacter pylori infects over half the world's population and causes a wide range of diseases, including gastritis, peptic ulcer, and two forms of gastric cancer. H. pylori infection elicits a variety of phenotypic responses in cultured gastric epithelial cells, including the expression of proinflammatory genes and changes in the actin cytoskeleton. Both of these responses are mediated by the type IV secretion system (TFSS) encoded by the cag pathogenicity island (cag PAI). We used human cDNA microarrays to examine the temporal transcriptional profiles of gastric AGS cells infected with H. pylori strain G27 and a panel of isogenic mutants to dissect the contributions of various genes in the cag PAI. Infection with G27 induced expression of genes involved in the innate immune response, cell shape regulation, and signal transduction. A mutant lacking the cagA gene, which encodes an effector molecule secreted by the TFSS and required for the host cell cytoskeletal response, induced the expression of fewer cytoskeletal genes. A mutant lacking cagE, which encodes a structural component of the TFSS, failed to up-regulate a superset of host genes, including the cagA-dependent genes, and many of the immune response genes. A mutant lacking the entire cag PAI failed to induce both the cagE-dependent genes and several transiently expressed cagE independent genes. Host cell transcriptional profiling of infection with isogenic strains offered a detailed molecular picture of H. pylori infection and provided insight into potential targets of individual virulence determinants such as tyrosine kinase and Rho GTPase signaling molecules.


Figures

Fig 1.
Fig 1.
Gastric epithelial cell transcriptional response to isogenic H. pylori strains. The expression profiles of AGS cells cocultured with isogenic strains of H. pylori (TC1: G27, vacA, cagA TC2: mock, G27, cagN, cagA, cagE, ΔPAI) for various lengths of time (TC1: 0, 0.5, 3, 6, 12 h; TC2: 0, 1, 3, 6, 12, 24) were determined for 22,571 human cDNAs arrayed on glass slides. The data were filtered to remove poor-quality spots. Genes were selected that had good data for 80% of the experiments and whose expression level changed by 3-fold or greater in at least two experiments. The gene profiles were organized by hierarchical clustering and displayed in matrices in which each row corresponds to an array element and each column corresponds to an experimental condition. The experiments are organized by increasing time of coculture with each strain, as shown in the key. Each measurement is the ratio of the treated sample vs. a common reference sample from uninfected AGS cells and is represented relative to the averaged time 0 measurements of each TC. The level of induction is indicated by color, as shown in the key (missing data are indicated in gray). (A) H. pylori-responsive genes. One hundred twenty-one induced genes (above) and 34 repressed genes (below) responded to coculture with H. pylori with similar kinetics in two independent experiments. Larger versions of these clusters, with gene names, can be found in Figs. 3 and 4. (B) cag PAI-dependent gene induction. Hierarchical clustering of the TC2 data revealed genes whose induction depended on an intact TFSS (clusters I and II, indicated by orange vertical bars) or cagA (clusters III, IV, and V, indicated by blue vertical bars). Larger versions of these clusters, with gene names, can be found in Figs. 5–10.
Fig 2.
Fig 2.
CagA-dependent gene expression profiles of gastric epithelial cells. The gene expression levels of all samples infected for 3 h or longer were compared between cells that received CagA (wild type, vacA, and cagN infections, indicated with blue lettering) vs. cells that did not (cagA, cagE, and ΔPAI infections, indicated with orange lettering), using SAM analysis. The nonzero transformed expression profiles of the genes from the resulting gene list were hierarchically clustered and are displayed as in Fig. 1. Replicate measurements of the expression levels of the TC1 wild-type infection are shown. The 603 genes identified as elevated in CagA-exposed cells and the 59 genes identified as decreased in CagA-exposed cells are indicated by vertical red and green bars, respectively. Larger versions of the elevated and decreased clusters can be found in Figs. 11 and 12.

References

    1. Montecucco C. & Rappuoli, R. (2001) Nat. Rev. Mol. Cell. Biol. 2, 457-466. - PubMed
    1. Asahi M., Azuma, T., Ito, S., Ito, Y., Suto, H., Nagai, Y., Tsubokawa, M., Tohyama, Y., Maeda, S., Omata, M., Suzuki, T. & Sasakawa, C. (2000) J. Exp. Med. 191, 593-602. - PMC - PubMed
    1. Backert S., Ziska, E., Brinkmann, V., Zimny-Arndt, U., Fauconnier, A., Jungblut, P. R., Naumann, M. & Meyer, T. F. (2000) Cell Microbiol. 2, 155-164. - PubMed
    1. Odenbreit S., Puls, J., Sedlmaier, B., Gerland, E., Fischer, W. & Haas, R. (2000) Science 287, 1497-1500. - PubMed
    1. Segal E. D., Cha, J., Lo, J., Falkow, S. & Tompkins, L. S. (1999) Proc. Natl. Acad. Sci. USA 96, 14559-14564. - PMC - PubMed

Publication types

Substances