

Rapid and accurate detection of monoclonal immunoglobulin heavy chain gene rearrangement by DNA melting curve analysis in the LightCycler System
- PMID: 12411589
- PMCID: PMC1907354
- DOI: 10.1016/S1525-1578(10)60706-4
Rapid and accurate detection of monoclonal immunoglobulin heavy chain gene rearrangement by DNA melting curve analysis in the LightCycler System
Abstract
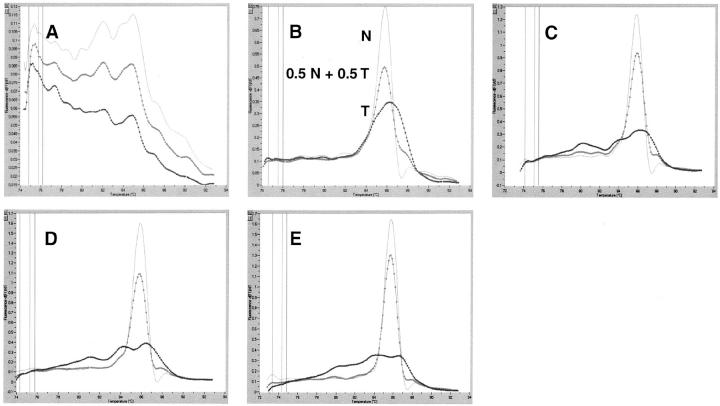
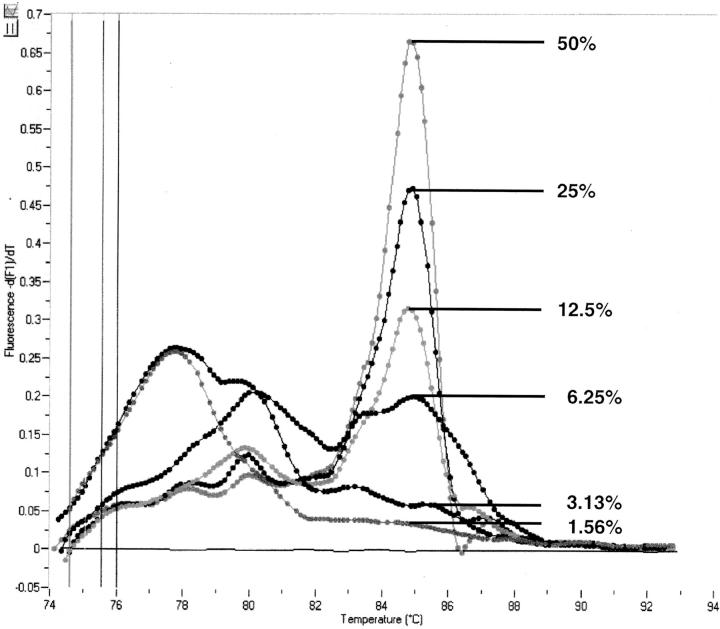
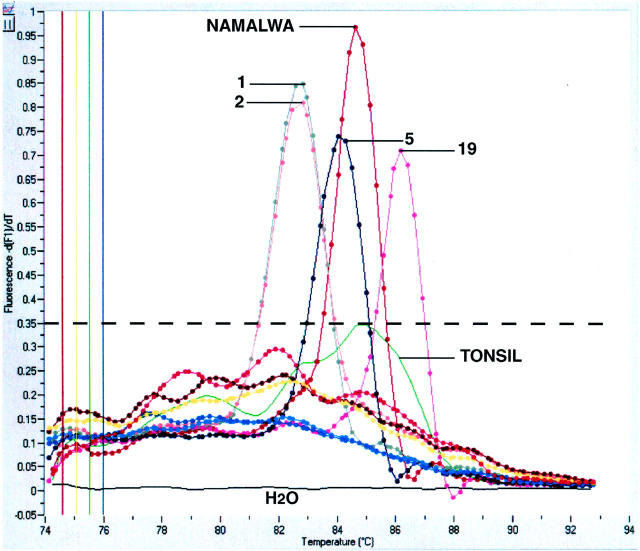
The detection of immunoglobulin heavy chain gene rearrangement (IgH-R) is a standard tool for distinguishing polyclonal from monoclonal B-cell populations. Current DNA-based polymerase chain reactions (PCR) strategies can diagnose monoclonal IgH-R either by measuring the length of the amplicon or by detecting gel mobility variations owing to sequence-dependent conformational changes. However, amplification and analysis remain sequential operations usually requiring manual transfer. We have developed a novel PCR strategy for detecting monoclonal IgH-R that monitors fluorescence of the specific double-stranded DNA binding dye SYBR Green I during melting curve analysis using the LightCycler System. We compared polyacrylamide gel electrophoresis (PAGE) versus melting curve analysis in 130 clinical DNA samples from formalin-fixed, paraffin-embedded (FFPE) tissues (mostly skin biopsies) of 128 patients. The identical FR3 primers were used to amplify the IgH variable region for both analytic techniques. We detected IgH-R in 24 DNA samples from FFPE tissue of 22 patients. Melting curve analysis, compared to PAGE, revealed no false negative and no false positive results, yielding both sensitivity and specificity equal to 100%. We also compared Southern blot analysis versus melting curve analysis in 23 clinical DNA samples from fresh-frozen lymph nodes of 23 patients. We detected IgH-R by melting curve analysis in 7 DNA samples from fresh-frozen lymph nodes. Melting curve analysis, compared to Southern blot analysis, revealed sensitivity equal to 58.3% (7 of 12) and specificity equal to 100% (11 of 11). We conclude that continuous fluorescence monitoring of PCR products with DNA melting curve analysis can rapidly and reproducibly distinguish polyclonal from monoclonal B-cell populations.
Figures
Similar articles
-
Detection of monoclonal immunoglobulin heavy chain gene rearrangement (FR3) in Thai malignant lymphoma by High Resolution Melting curve analysis.Diagn Pathol. 2010 May 19;5:31. doi: 10.1186/1746-1596-5-31. Diagn Pathol. 2010. PMID: 20482846 Free PMC article.
-
The application of a PCR technique for the detection of immunoglobulin heavy chain gene rearrangements in fresh or paraffin-embedded skin tissue.Pathology. 2001 May;33(2):222-5. Pathology. 2001. PMID: 11358058
-
Immunoglobulin heavy chain gene analysis in lymphomas: a multi-center study demonstrating the heterogeneity of performance of polymerase chain reaction assays.J Mol Diagn. 2002 May;4(2):81-9. doi: 10.1016/S1525-1578(10)60685-X. J Mol Diagn. 2002. PMID: 11986398 Free PMC article.
-
[Role of the Nucleolus in Rearrangements of the IGH Locus].Mol Biol (Mosk). 2018 Mar-Apr;52(2):210-219. doi: 10.7868/S0026898418020040. Mol Biol (Mosk). 2018. PMID: 29695689 Review. Russian.
-
Monitoring hybridization during polymerase chain reaction.J Chromatogr B Biomed Sci Appl. 2000 Apr 28;741(1):3-13. doi: 10.1016/s0378-4347(00)00055-4. J Chromatogr B Biomed Sci Appl. 2000. PMID: 10839126 Review.
Cited by
-
Detection of clonal antigen receptor gene rearrangement in dogs with lymphoma by real-time polymerase chain reaction and melting curve analysis.BMC Vet Res. 2014 Jan 3;10:1. doi: 10.1186/1746-6148-10-1. BMC Vet Res. 2014. PMID: 24383544 Free PMC article.
-
Analytical detection of immunoglobulin heavy chain gene rearrangements in gastric lymphoid infiltrates by peak area analysis of the melting curve in the LightCycler System.J Mol Diagn. 2007 Jul;9(3):351-7. doi: 10.2353/jmoldx.2007.050129. J Mol Diagn. 2007. PMID: 17591935 Free PMC article.
-
Rapid detection of clonal T-cell receptor-beta gene rearrangements in T-Cell lymphomas using the LightCycler-polymerase chain reaction with DNA melting curve analysis.J Mol Diagn. 2005 Feb;7(1):81-8. doi: 10.1016/s1525-1578(10)60012-8. J Mol Diagn. 2005. PMID: 15681478 Free PMC article.
-
Screening for residual disease in pediatric burkitt lymphoma using consensus primer pools.Adv Hematol. 2009;2009:412163. doi: 10.1155/2009/412163. Epub 2009 Apr 15. Adv Hematol. 2009. PMID: 19890467 Free PMC article.
-
Detection of monoclonal immunoglobulin heavy chain gene rearrangement (FR3) in Thai malignant lymphoma by High Resolution Melting curve analysis.Diagn Pathol. 2010 May 19;5:31. doi: 10.1186/1746-1596-5-31. Diagn Pathol. 2010. PMID: 20482846 Free PMC article.
References
-
- Sioutos N, Bagg A, Michaud GY, Irving SG, Hartmann DP, Siragy H, Oliveri DR, Locker J, Cossman J: Polymerase chain reaction versus Southern blot hybridization: detection of immunoglobulin heavy-chain gene rearrangements. Diagn Mol Pathol 1995, 4:8-13 - PubMed
-
- Lehman CM, Sarago C, Nasim S, Comerford J, Karcher DS, Garrett CT: Comparison of PCR with southern hybridization for the routine detection of immunoglobulin heavy chain gene rearrangements. Am J Clin Pathol 1995, 103:171-176 - PubMed
-
- Tierens A, Lozano MD, Wickert R, Chan WC, Greiner TC: High-resolution analysis of immunoglobulin heavy-chain gene rearrangements using denaturing gradient gel electrophoresis. Diagn Mol Pathol 1996, 5:159-165 - PubMed
-
- Meier VS, Rufle A, Gudat F: Simultaneous evaluation of T- and B-cell clonality, t(11;14) and t(14;18), in a single reaction by a four-color multiplex polymerase chain reaction assay and automated high-resolution fragment analysis: a method for the rapid molecular diagnosis of lymphoproliferative disorders applicable to fresh-frozen and formalin-fixed, paraffin-embedded tissues, blood, and bone marrow aspirates. Am J Pathol 2001, 159:2031-2043 - PMC - PubMed
Publication types
MeSH terms
Substances
LinkOut - more resources
Full Text Sources
Medical
