

Automated modelling of signal transduction networks
- PMID: 12413400
- PMCID: PMC137599
- DOI: 10.1186/1471-2105-3-34
Automated modelling of signal transduction networks
Abstract
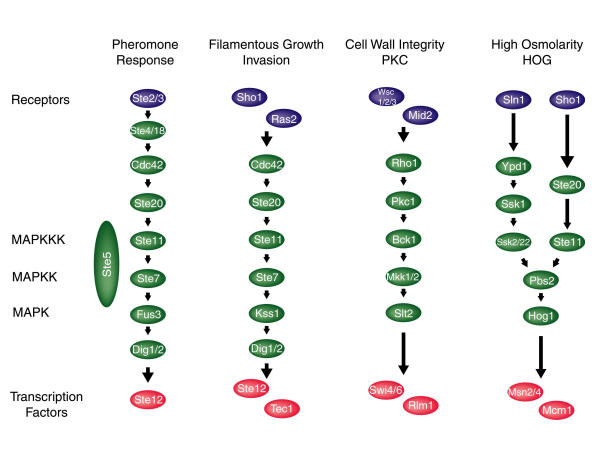
Background: Intracellular signal transduction is achieved by networks of proteins and small molecules that transmit information from the cell surface to the nucleus, where they ultimately effect transcriptional changes. Understanding the mechanisms cells use to accomplish this important process requires a detailed molecular description of the networks involved.
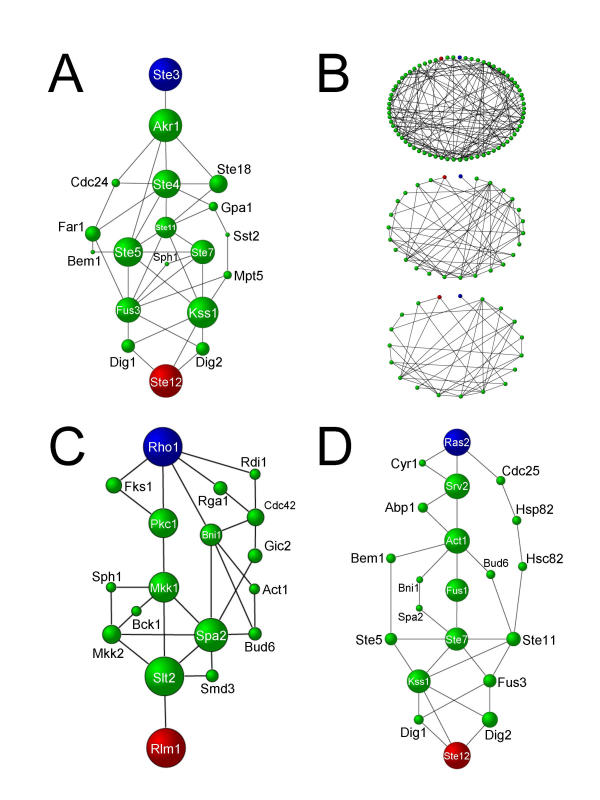
Results: We have developed a computational approach for generating static models of signal transduction networks which utilizes protein-interaction maps generated from large-scale two-hybrid screens and expression profiles from DNA microarrays. Networks are determined entirely by integrating protein-protein interaction data with microarray expression data, without prior knowledge of any pathway intermediates. In effect, this is equivalent to extracting subnetworks of the protein interaction dataset whose members have the most correlated expression profiles.
Conclusion: We show that our technique accurately reconstructs MAP Kinase signaling networks in Saccharomyces cerevisiae. This approach should enhance our ability to model signaling networks and to discover new components of known networks. More generally, it provides a method for synthesizing molecular data, either individual transcript abundance measurements or pairwise protein interactions, into higher level structures, such as pathways and networks.
Figures
References
-
- Ideker T, Thorsson V, Ranish JA, Christmas R, Buhler J, Eng JK, R Bumgarner, Goodlett DR, Aebersold R, Hood L. Integrated genomic and proteomic analyses of a systematically perturbed metabolic network. Science. 2001;292:929–934. - PubMed
-
- Schwikowski B, Uetz P, Fields S. A network of protein-protein interactions in yeast. Nat Biotechnol. 2000;18:1257–1261. - PubMed
-
- Uetz P, Giot L, Cagney G, Mansfield TA, Judson RS, Knight JR, Lockshon D, Narayan V, Srinivasan M, Pochart P. A comprehensive analysis of protein-protein interactions in Saccharomyces cerevisiae. Nature. 2000;403:623–627. - PubMed
-
- Hughes TR, Marton MJ, Jones AR, Roberts CJ, Stoughton R, Armour CD, HA Bennett, Coffey E, Dai H, He YD. Functional discovery via a compendium of expression profiles. Cell. 2000;102:109–126. - PubMed
Publication types
MeSH terms
Substances
LinkOut - more resources
Full Text Sources
Other Literature Sources
Molecular Biology Databases
