. 2002 Nov;161(5):1669-77.
doi: 10.1016/S0002-9440(10)64444-6.

Constitutive retinal CD200 expression regulates resident microglia and activation state of inflammatory cells during experimental autoimmune uveoretinitis

Affiliations

Constitutive retinal CD200 expression regulates resident microglia and activation state of inflammatory cells during experimental autoimmune uveoretinitis

Cathryn Broderick et al. Am J Pathol. 2002 Nov.

Abstract

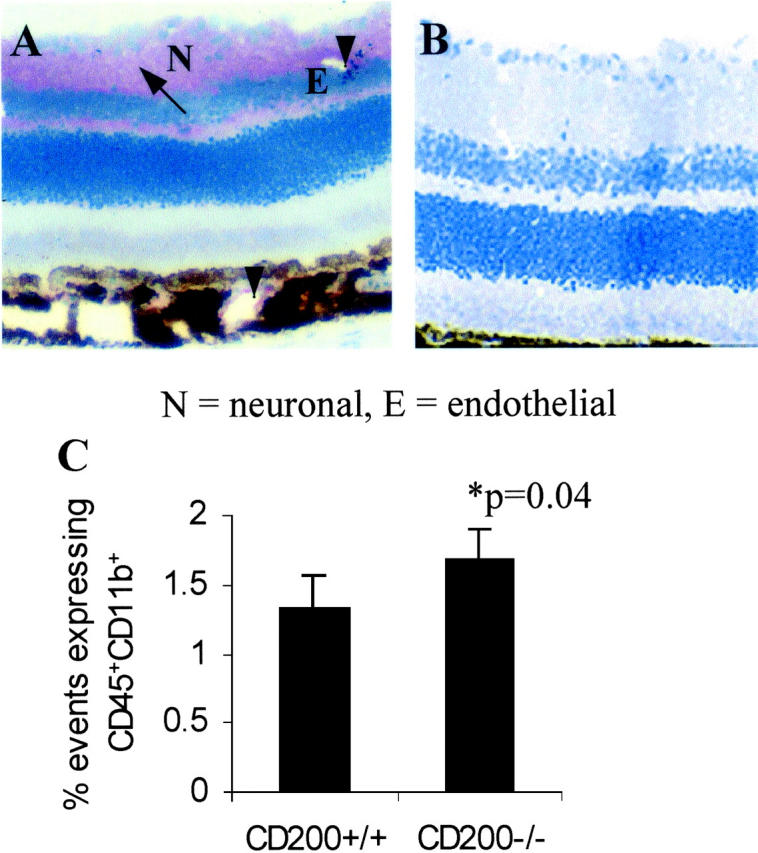
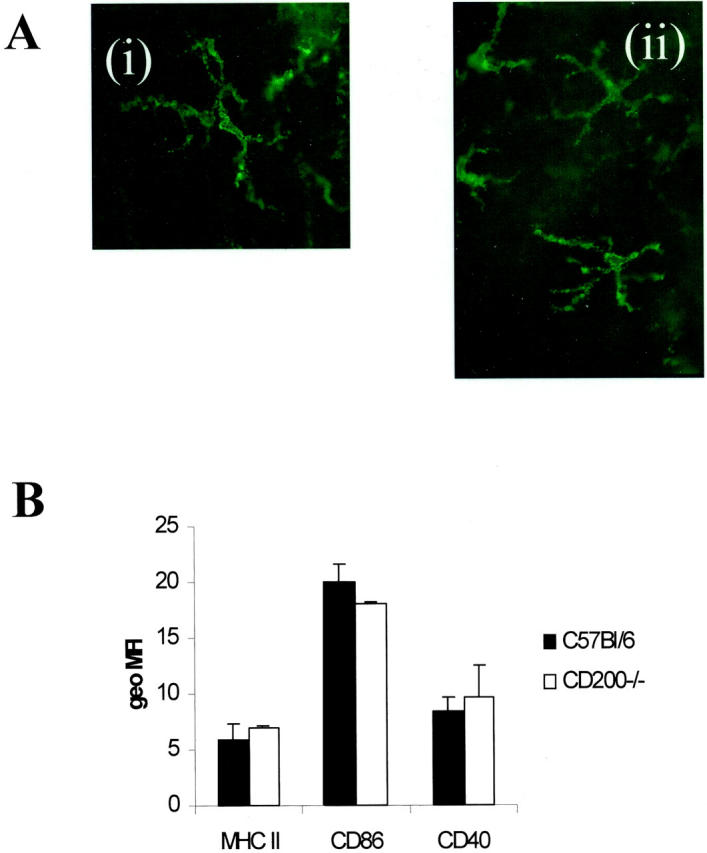
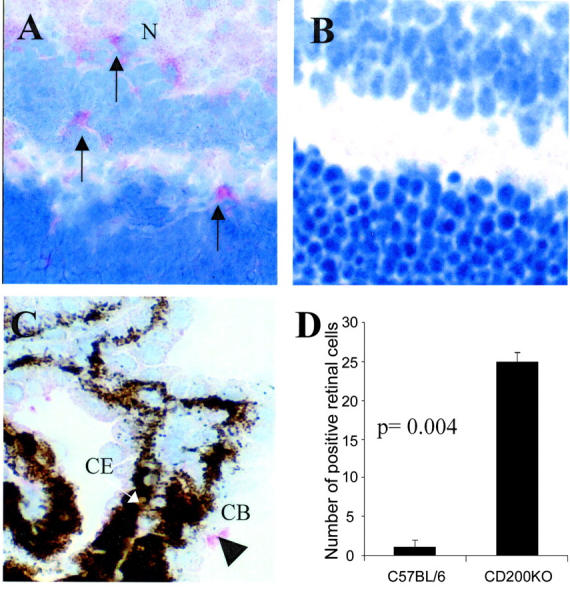
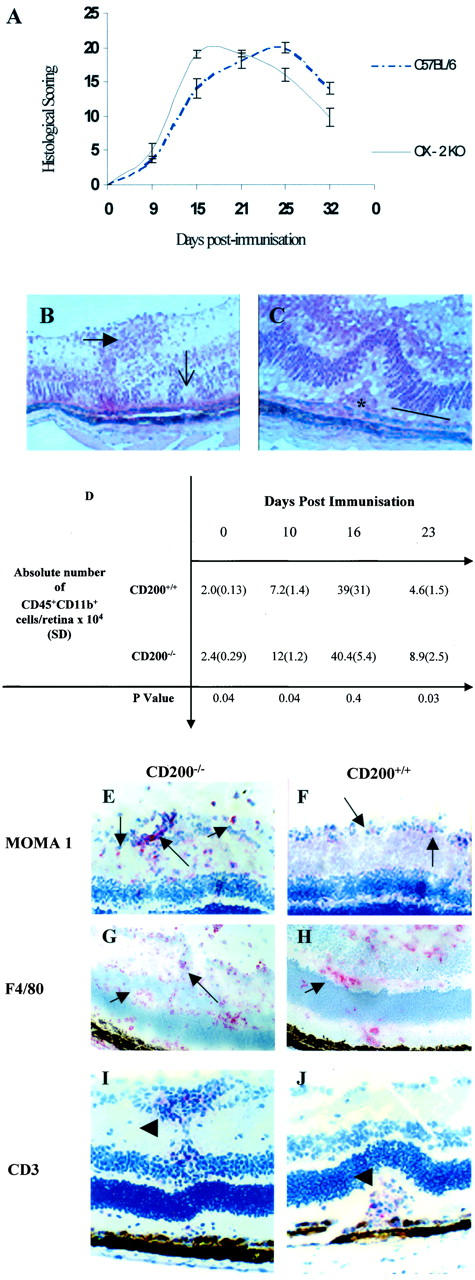
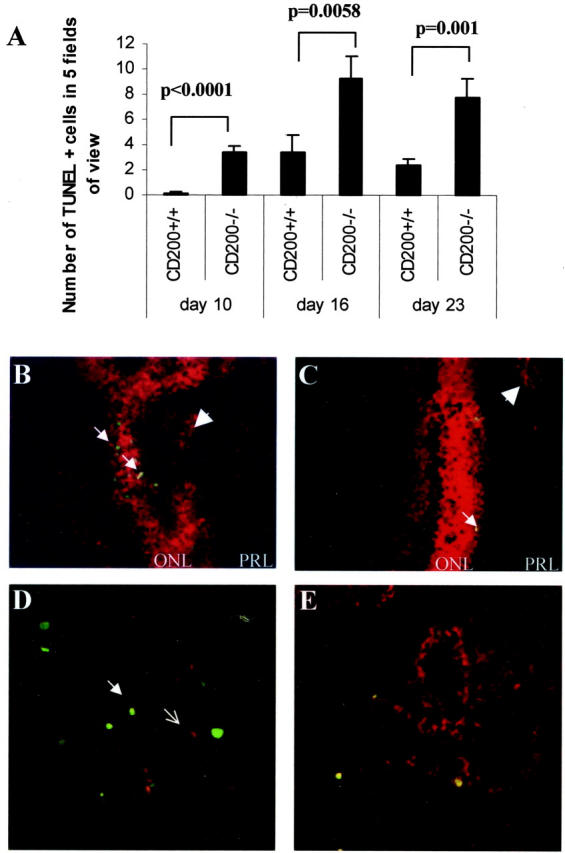
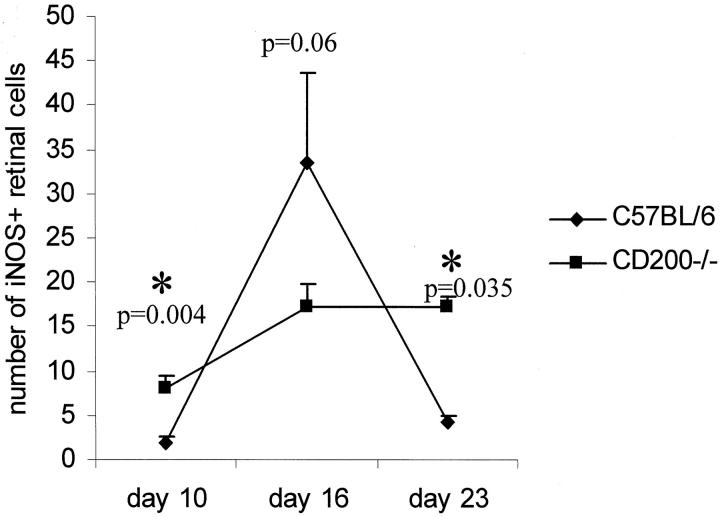
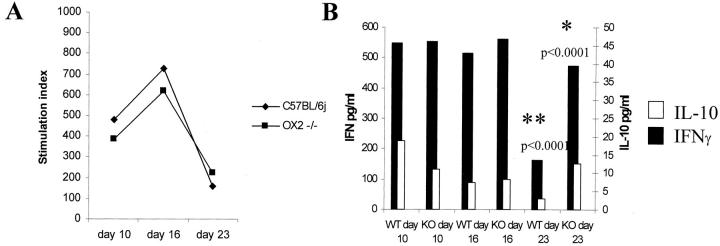
Recent evidence supports the notion that tissue OX2 (CD200) constitutively provides down-regulatory signals to myeloid-lineage cells via CD200-receptor (CD200R). Thus, mice lacking CD200 (CD200(-/-)) show increased susceptibility to and accelerated onset of tissue-specific autoimmunity. In the retina there is extensive expression of CD200 on neurons and retinal vascular endothelium. We show here that retinal microglia in CD200(-/-) mice display normal morphology, but unlike microglia from wild-type CD200(+/+) mice are present in increased numbers and most significantly, express inducible nitric oxide synthase (NOS2), a macrophage activation marker. Onset and severity of uveitogenic peptide (1-20) of interphotoreceptor retinoid-binding protein-induced experimental autoimmune uveoretinitis is accelerated in CD200(-/-) mice and although tissue destruction appears no greater than seen in CD200(+/+) mice, there is continued increased ganglion and photoreceptor cell apoptosis. Myeloid cell infiltrate was increased in CD200(-/-) mice during experimental autoimmune uveoretinitis, although NOS2 expression was not heightened. The results indicate that the CD200:CD200R axis regulates retinal microglial activation. In CD200(-/-) mice the release of suppression of tonic macrophage activation, supported by increased NOS2 expression in the CD200(-/-) steady state accelerates disease onset but without any demonstration of increased target organ/tissue destruction.


Figures

Figure 1.
Figure 1.
APAAP immunohistochemical detection of CD200 expression in retina of CD200+/+ and CD200−/− mice. A: CD200 is abundantly expressed on endothelium (E) (arrowhead) and neuronal axons and cell bodies in CD200+/+mouse (N) (arrow) normal retina but is expectedly absent in CD200−/− mice (B). C: MG (defined by CD45+CD11b+ population by two-color flow cytometric analysis) are present in significantly greater numbers within CD200−/− retina (n = 7, P = 0.04). Results shown are percentages of total events collected. Unlike CNS and rat retina, mouse retinal MG and macrophages express equivalent levels of CD45, and cannot therefore be differentiated by CD45low or CD45high, respectively. Original magnifications: ×250 (A); ×300 (B).
Figure 2.
Figure 2.
CD200−/− MG have normal morphology and express low amounts of MHC class II and co-accessory molecules. A: Retinal whole-mount immunofluorescence demonstrating F4/80 expression shows that the morphology of CD200−/− MG do not conform to an activated phenotype and resemble CD200+/+ retinal MG. Both characteristically display ramified forms with no loss of processes. B: Three-color flow cytometric assessment of CD45+CD11b+ MG show that in both animals there is an equivalent low level of MHC class II, CD40, and CD86 expression (mean fluorescent intensity). The low levels depicted are known to be distinct from background because experiments showed consistent, repeated mean fluorescent intensity levels greater than the limits defined during set up using isotype-positive and -negative controls (mean geometric fluorescent intensity, 2.3 ± 0.9). Original magnifications: ×750 (Ai); ×700 (Aii).
Figure 3.
Figure 3.
CD200−/− MG display increased constitutive NOS2 expression. Immunohistochemical sections demonstrating NOS2 expression detected with SA:ABC-AP. NOS2-positive MG cells were detected within normal CD200−/− retina (A), and primarily absent in CD200+/+ retina (B). C shows that within the CD200+/+ eye NOS2 expression was confined primarily to nonretinal sites such as ciliary body (CB) (arrowhead; CE, ciliary body epithelium that is pigmented). Counting confirmed that within the retina there is a significant increase in CD200−/− MG NOS2 expression. For quantification, mean NOS2-positive retinal cells were calculated from a minimum of three sections per eye at each time point (n = 9; groups of three, three sections per eye). Original magnifications: ×600 (A); ×650 (B); ×300 (C).
Figure 4.
Figure 4.
CD200−/− mice have an earlier and increased severity of IRBP peptide 1-20 induced EAU. A: Graphic representation of histological scoring of EAU disease severity in CD200−/− and CD200+/+mice, graded by combining infiltration levels in anterior and posterior areas with tissue damage. CD200−/− mice have an accelerated onset of disease achieving peak disease earlier than CD200+/+mice. Ultimately, the structural damage was not significantly different between the two groups. No difference in clinical disease features between CD200+/+ and CD200−/− mice were observed. B and C: Representative H&E preparations of retinal sections showing EAU features at day 16 after immunization and include retinal folds (open arrow), vasculitis (closed arrow), and photoreceptor cell destruction (line) and granuloma formation (asterisk). D: Absolute numbers of CD45+CD11b+ retinal infiltrate during EAU in CD200+/+ and CD200−/− mice, confirming earlier and increased inflammation in CD200−/− mice. MOMA-1 (E and F), F4/80 (G and H), and CD3 (I and J) were visualized with SA ABC-AP on section of retinal tissue from CD200−/− mice (E, G, and I) and CD200+/+ mice (F, H, and J). In CD200−/− mice, there is an increased infiltration of MOMA-1 and F4/80 cells (arrows) but CD3+ T cell infiltrate (arrowhead) is equivalent in both CD200−/− and CD200+/+ mice, as confirmed by flow cytometry (D). Original magnifications: ×300 (B); ×500 (C); ×200 (E, F, I, and J); ×150 (G and H).
Figure 5.
Figure 5.
Apoptosis of retinal cells was increased throughout the course of IRBP peptide 1-20 induced EAU. A: Histogram shows that there was a significant increase in rate of cellular apoptosis as detected by TUNEL staining in CD200−/− mice. In particular, extent of apoptosis was maintained through the course of disease in CD200−/− mice. Retinal TUNEL-positive cells were counted in five fields of view and mean counts calculated from a minimum of three sections per eye at each time point, n = 9. B and C: TUNEL-positive retinal cells within the outer nuclear layer (ONL) (arrows) and not mainly within the foci of infiltrating leukocytes within the photoreceptor layer (PRL) (arrowheads) in both CD200−/− and CD200+/+, respectively. D and E demonstrate further that the majority of TUNEL-positive (FITC) cells are not identified as CD3 (D, red; open arrow) or F4/80 (E) dual-stained cells. Original magnifications: ×40 (A); ×300 (B); ×200 (C); ×500 (D); ×500 (E).
Figure 6.
Figure 6.
Increased NOS2 expression in CD200−/− at earlier stages of IRBP peptide 1-20 induced EAU but not during peak disease. Line graph representing quantification of NOS2 expression in retinal sections at different phases of EAU. Mean positive NOS2 cells calculated from a minimum of three sections per eye at each time point, n = 9.
Figure 7.
Figure 7.
Splenocyte responses are maintained in CD200−/− mice. A: Splenocyte responses were equal at each time point between both groups of animals as represented by stimulation indices [background counts were 1120 (109) and Con A responses were 6711(1504) cpm (SD)]. Representative of repeated experiments, supernatants from splenocyte cultures, were further analyzed by capture ELISA for IL-10 and IFN-γ. B: There was a significant increase in IFN-γ and IL-10 response in CD200−/− mice 23 days after immunization. Nonstimulated splenocyte supernatants were below detection of ELISA, indicating that the observed response is peptide-specific and not because of the use of adjuvant.

Similar articles

Cited by

References

    1. Forrester JV, McMenamin PG: Immunopathogenic mechanisms in intraocular inflammation. Chem Immunol 1999, 73:159-185 - PubMed
    1. Laszlo DJ, Henson PM, Remigio LK, Weinstein L, Sable C, Noble PW, Riches DW: Development of functional diversity in mouse macrophages. Mutual exclusion of 2 phenotypic states. Am J Pathol 1993, 143:587-597 - PMC - PubMed
    1. Takahashi K, Yamenura F, Naito M: Differentiation, maturation and proliferation of macrophages in yolk sac: a light microscope, enzyme-cytochemical immunohistochemical and ultrastructural study. J Leukoc Biol 1989, 45:87-96 - PubMed
    1. Yamada M, Naito M, Takahasi K: Kupffer cell proliferation and glucan induced granuloma formation in mice depleted of blood monocytes by strontium-89. J Leukoc Biol 1990, 47:195-205 - PubMed
    1. Rooijen N, Kors N, Vd Endn M, Dijkstra CD: Depletion and repopulation of macrophages in spleen and liver of rat after intravenous treatment with liposome encapsulated di-chloromethylene diphosphate. Cell Tissue Res 1990, 260:215-222 - PubMed

Publication types

MeSH terms

LinkOut - more resources