

doi: 10.1128/jvi.76.23.11809-11818.2002.
Inhibition of polyomavirus ori-dependent DNA replication by mSin3B
Affiliations
- PMID: 12414923
- PMCID: PMC136908
- DOI: 10.1128/jvi.76.23.11809-11818.2002
Item in Clipboard
Inhibition of polyomavirus ori-dependent DNA replication by mSin3B
J Virol.
2002 Dec.
Abstract
When tethered in cis to DNA, the transcriptional corepressor mSin3B inhibits polyomavirus (Py) ori-dependent DNA replication in vivo. Histone deacetylases (HDACs) appear not to be involved, since tethering class I and class II HDACs in cis does not inhibit replication and treating the cells with trichostatin A does not specifically relieve inhibition by mSin3B. However, the mSin3B L59P mutation that impairs mSin3B interaction with N-CoR/SMRT abrogates inhibition of replication, suggesting the involvement of N-CoR/SMRT. Py large T antigen interacts with mSin3B, suggesting an HDAC-independent mechanism by which mSin3B inhibits DNA replication.
Figures
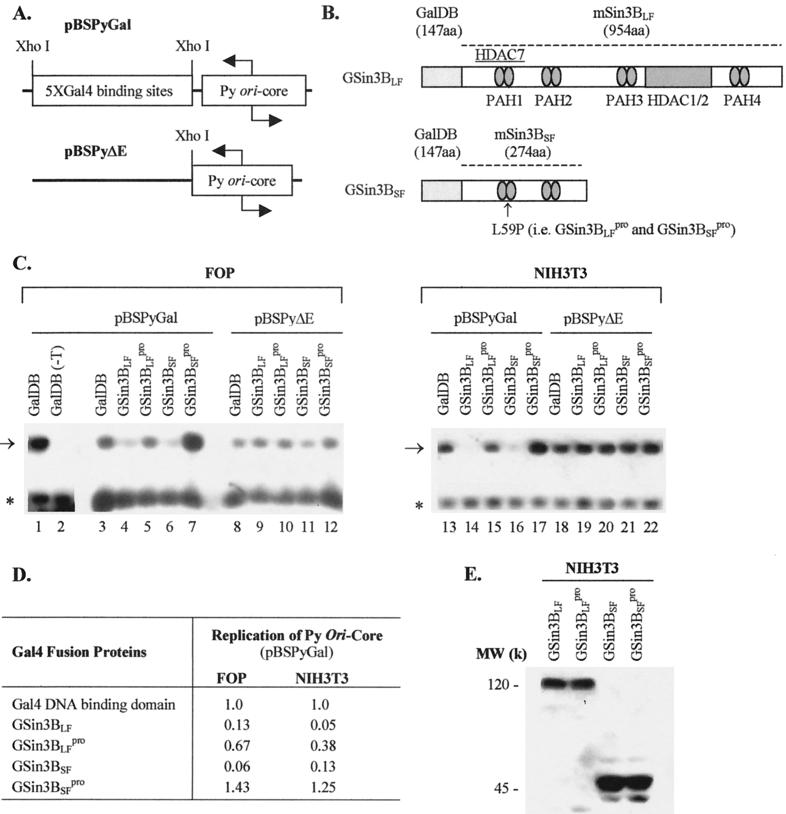
Analysis of Py ori-core DNA replication with mSin3B. (A) Structures of the origin regions of test plasmids used for replication assays. (B) Structures of mSin3B and its variants fused to Gal4 DNA-binding domains. Four paired amphipathic α-helix domains (PAH) of mSin3BLF and its interaction domains for HDAC1/2 and HDAC7 are indicated. mSin3BSF only contains the first two PAH domains. The proline substitution for leucine (L to P) at residue 59 that disrupts the interaction with the C terminus of N-CoR is noted. (C) Examples of replication assays performed with the test plasmids pBSPyGal and pBSPyΔE in FOP (left panel) and NIH 3T3 (right panel) cells. Test plasmids and cotransfected expression vectors are indicated above lanes. Additional amount of PyLT was provided by pMKSO11 for baseline replications with one exception indicated as GalDB (−T), where pMKSO11 was not cotransfected. The arrow and the asterisk, respectively, indicate the positions of replicated test DNA (upper band) and the nonreplicated test DNA as a reference (lower band). (D) Average from three independent transfection assays represented by panel C. (E) Protein expression of Gal4 fusion proteins in NIH 3T3 cells analyzed by Western blotting. The molecular weights of these proteins are indicated on the left side of the blot.
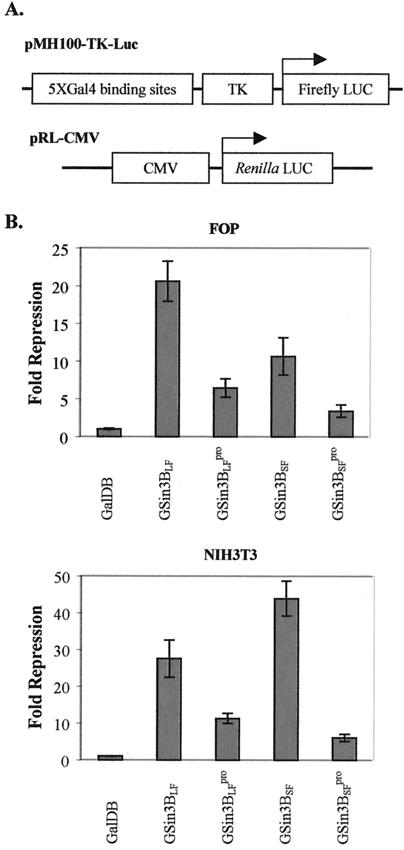
Repression of gene expression by mSin3B. (A) Structure of the test plasmids. pMH100-TK-Luc contains five Gal4-binding sites located upstream of the thymidine kinase (TK) promoter and the firefly luciferase gene as a reporter. pRL-CMV contains the cytomegalovirus (CMV) promoter and Renilla luciferase gene as a reference for transfection assays. (B) Summary of data collected from the luciferase assays with mSin3B in FOP (top chart) and NIH 3T3 (bottom chart) cells. The luciferase assays were done with FOP and NIH 3T3 cell extracts prepared 36 to 48 h posttransfection as described in Materials and Methods. The fold repression from three independent transfection assays is shown as the mean ± the standard deviation. The fold repression for each protein is relative to that of GalDB alone.
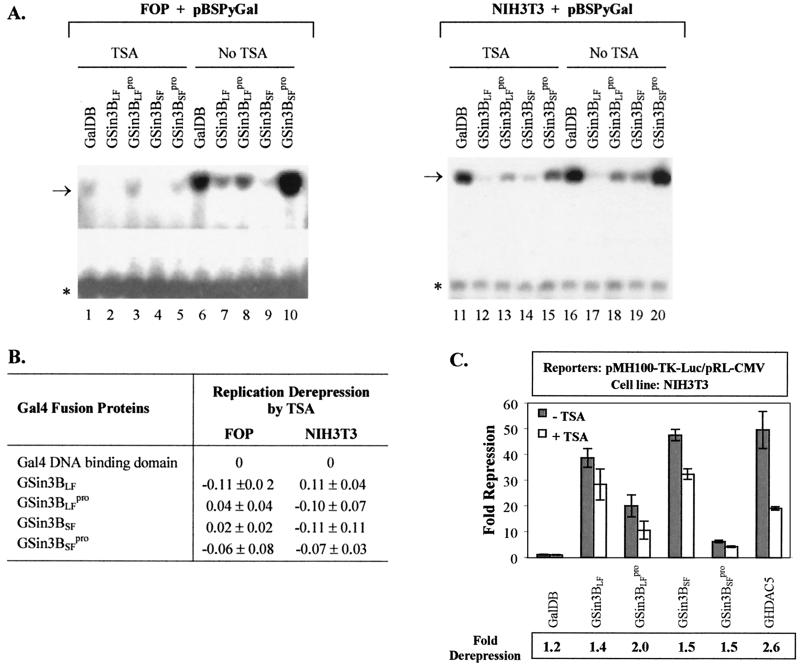
Effects of TSA on repression of Py DNA replication by mSin3B. (A) Examples of replication assays performed with TSA treatment as described in Materials and Methods. Additional PyLT were provided by pMKSO11 for baseline replications in FOP and NIH 3T3 cells. Test plasmid pBSPyGal, treatments with or without TSA, and test proteins are indicated above lanes. The arrow and the asterisk, respectively, indicate the positions of replicated test DNA (upper band) and the nonreplicated test DNA as a reference (lower band). (B) Replication derepression measured from three independent transfection assays represented by panel A. Fold derepression for each Gal4 fusion protein was calculated as the ratio of the level of pBSPyGal replication with TSA treatment to that without treatment. Replication derepression by TSA, represented as the difference in fold derepression between each Gal4 fusion protein and GalDB alone, is shown as the mean ± standard deviation of values from three independent transfection assays. (C) Effects of TSA on repression of gene expression by repressors. Test proteins with (+) or without (−) TSA treatment are indicated along the x axis. The fold repression from three independent transfection assays is shown as the mean ± standard deviation. The fold repression for each protein is relative to that for GalDB alone, set as 1. The fold derepression for each protein, calculated as the ratio of luciferase expression with TSA treatment to that without TSA, is also shown as the average of values from three independent transfection assays.
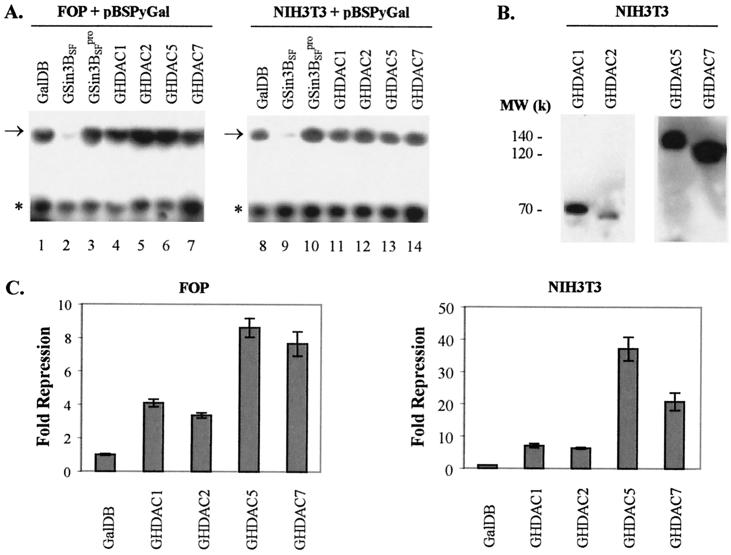
Analysis of Py ori-core DNA replication with histone deacetylases. (A) Examples of replication assays performed with HDACs in FOP (left panel) and NIH 3T3 (right panel) cells as described in Materials and Methods. PyLT provided by pMKSO11 was required for baseline replication in both cell lines. Test plasmid pBSPyGal and cotransfected expression vectors are indicated above lanes. The arrow and the asterisk, respectively, indicate the positions of replicated test DNA (upper band) and the nonreplicated test DNA as a reference (lower band). (B) Protein expression of Gal4 fusion proteins in NIH 3T3 cells. Cell extracts were analyzed by Western blotting. Molecular weights of these proteins are indicated on the left side of the blot. (C) Summary of data collected from the luciferase assays with HDACs in FOP (left chart) and NIH 3T3 (right chart) cells. The fold repression from three independent transfection assays is shown as the mean ± the standard deviation. The fold repression for each protein is relative to that of GalDB alone.
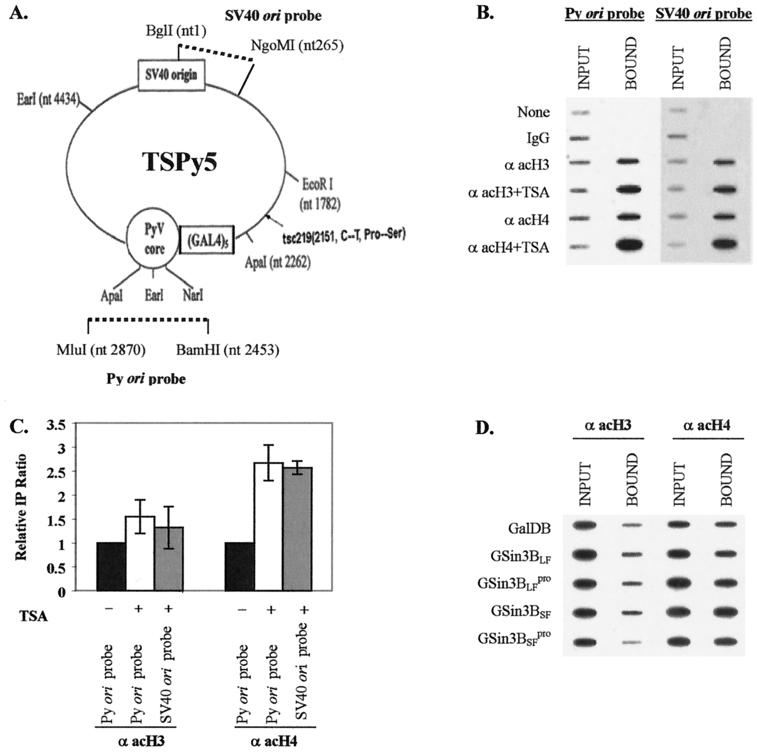
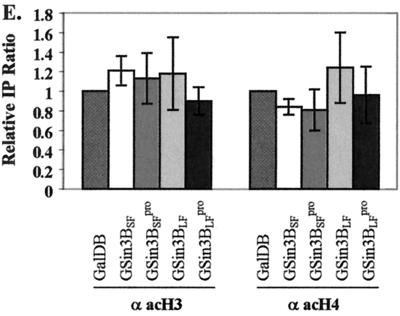
Acetylation changes of nucleosomal histones around Py ori-core with mSin3B. (A) Schematic representation of TSPy5 with location and orientation of the Py ori-core and adjacent Gal4-binding sites. Insertion position and orientation for the Py ori-core and adjacent Gal4-binding sites in the SV40 tsc219 genome are indicated. Fragments used to generate Py ori probe and SV40 ori probe for ChIP assays are indicated with broken lines. (B) Example of ChIP assays from TSA-treated or untreated cells. TSPy5 chromatin fragments immunoprecipitated with antiacetylated H3 and H4, and DNA input (INPUT) and DNA immunoprecipitated (BOUND) analyzed by Py ori and SV40 ori probes as indicated above the lanes. Antibodies used for ChIP assays and with or without TSA treatment are indicated to the left to the corresponding rows. (C) Average from three independent experiments represented in panel B. The immunoprecipitation (IP) ratio for each Gal4 chimera protein was calculated as the ratio of BOUND DNA intensity to INPUT DNA intensity quantified from slot blots. Relative IP ratio was measured by comparing each IP ratio relative to that (set as 1) for cells without TSA treatment. (D) Example of ChIP assays with mSin3B by using Py ori probe. DNA input (INPUT) and coimmunoprecipitated chromatin DNA (BOUND) with anti-acetyl H3 (α acH3) or H4 antibody (α acH4) analyzed by slot blot with Py ori probe are indicated above lane and Gal4 chimera proteins cotransfected are indicated at the left. (E) Average from three independent experiments represented in panel B. Relative IP ratio (mean value) was measured by comparing each IP ratio relative to that for GalDB set as 1. The standard deviation is indicated as a bar.
Acetylation changes of nucleosomal histones around Py ori-core with mSin3B. (A) Schematic representation of TSPy5 with location and orientation of the Py ori-core and adjacent Gal4-binding sites. Insertion position and orientation for the Py ori-core and adjacent Gal4-binding sites in the SV40 tsc219 genome are indicated. Fragments used to generate Py ori probe and SV40 ori probe for ChIP assays are indicated with broken lines. (B) Example of ChIP assays from TSA-treated or untreated cells. TSPy5 chromatin fragments immunoprecipitated with antiacetylated H3 and H4, and DNA input (INPUT) and DNA immunoprecipitated (BOUND) analyzed by Py ori and SV40 ori probes as indicated above the lanes. Antibodies used for ChIP assays and with or without TSA treatment are indicated to the left to the corresponding rows. (C) Average from three independent experiments represented in panel B. The immunoprecipitation (IP) ratio for each Gal4 chimera protein was calculated as the ratio of BOUND DNA intensity to INPUT DNA intensity quantified from slot blots. Relative IP ratio was measured by comparing each IP ratio relative to that (set as 1) for cells without TSA treatment. (D) Example of ChIP assays with mSin3B by using Py ori probe. DNA input (INPUT) and coimmunoprecipitated chromatin DNA (BOUND) with anti-acetyl H3 (α acH3) or H4 antibody (α acH4) analyzed by slot blot with Py ori probe are indicated above lane and Gal4 chimera proteins cotransfected are indicated at the left. (E) Average from three independent experiments represented in panel B. Relative IP ratio (mean value) was measured by comparing each IP ratio relative to that for GalDB set as 1. The standard deviation is indicated as a bar.
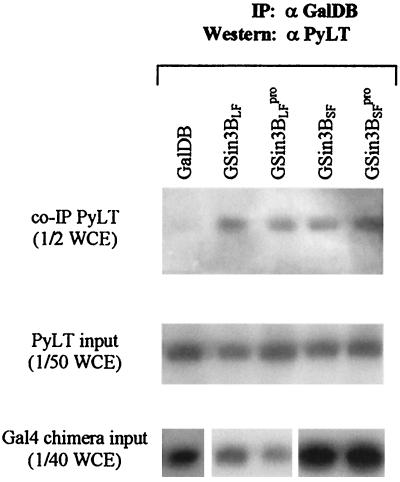
Analysis of PyLT coimmunoprecipitated with Gal4 fusion mSin3B. Cells extracts from NIH 3T3 cells transiently cotransfected with expression vector for PyLT and one of the expression vectors for Gal4 fusion proteins incubated with rabbit polyclonal anti-GalDB antibody are displayed. One-half of the immune complexes (top panel), equivalent to one-half of whole-cell extracts (WCE), one-fiftieth of WCE for measurement of input PyLT (middle panel), and one-fortieth of WCE for measurement of input Gal4 chimera (bottom panel) were analyzed by Western blotting with anti-PyLT antisera and rabbit polyclonal anti-GalDB antibody. Gal4 chimera transfected are indicated above lane. α PyLT, anti-PyLT antibody; α GalDB, anti-GalDB antibody.
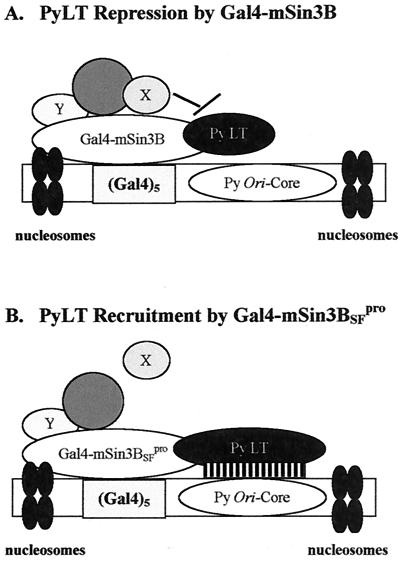
Possible roles of mSin3B in Py ori-core DNA replication. (A) Schematic suggesting mSin3B interacts with PyLT and uses repressive activities or components (X) other than HDACs to repress activity of PyLT, thereby inhibiting Py ori-core DNA replication. (B) mSin3BSFpro, one of L59P mutants, lacks repression possibly due to disrupted interaction with components (X), including N-CoR/SMRT. Recruitment of PyLT through interaction instead helps stimulate DNA replication.
References
-
- Alexiadis, V., L. Halmer, and C. Gruss. 1997. Influence of core histone acetylation on SV40 minichromosome replication in vitro. Chromosoma 105:324-331. - PubMed
-
- Alland, L., R. Muhle, H. Hou, J. Potes, L. Chin, N. Schreiber-Agus, and R. A. Depinho. 1997. Role for N-CoR and histone deacetylase in Sin3-mediated transcriptional repression. Nature 387:49-55. - PubMed
-
- Amin, A. A., Y. Murakami, and J. Hurwitz. 1994. Initiation of DNA replication by simian virus 40 T antigen is inhibited by the p107 protein. J. Biol. Chem. 269:7735-7743. - PubMed
-
- Ayer, D. E. 1999. Histone deacetylases: transcriptional repression with Siners and NuRDs. Trends Cell Biol. 9:193-198. - PubMed
Publication types
MeSH terms
Substances
Grants and funding
LinkOut - more resources
Full Text Sources
Research Materials
