Comparative Study
. 2002 Dec;76(23):11931-42.
doi: 10.1128/jvi.76.23.11931-11942.2002.

Recombinant respiratory syncytial virus with the G and F genes shifted to the promoter-proximal positions

Affiliations
Comparative Study

Recombinant respiratory syncytial virus with the G and F genes shifted to the promoter-proximal positions

Christine Krempl et al. J Virol. 2002 Dec.

Abstract

The genome of human respiratory syncytial virus (RSV) encodes 10 mRNAs and 11 proteins in the order 3'-NS1-NS2-N-P-M-SH-G-F-M2-1/M2-2-L-5'. The G and F glycoproteins are the major RSV neutralization and protective antigens. It seems likely that a high level of expression of G and F would be desirable for a live RSV vaccine. For mononegaviruses, the gene order is a major factor controlling the level of mRNA and protein expression due to the polar gradient of sequential transcription. In order to increase the expression of G and F, recombinant RSVs based on strain A2 were constructed in which the G or F gene was shifted from the sixth or seventh position (in a genome lacking the SH gene), respectively, to the first position (rRSV-G1/DeltaSH and rRSV-F1/DeltaSH, respectively). Another virus was made in which G and F were shifted together to the first and second positions, respectively (rRSV-G1F2/DeltaSH). Shifting one or two genes to the promoter-proximal position resulted in increased mRNA and protein expression of the shifted genes, with G and F expression increased up to 2.4-and 7.8-fold, respectively, at the mRNA level and approximately 2.5-fold at the protein level, compared to the parental virus. Interestingly, the transcription of downstream genes was not greatly affected even though shifting G or F, or G and F together, had the consequence of moving the block of genes NS1-NS2-N-P-M-(G) one or two positions further from the promoter. The efficiency of replication of the gene shift viruses in vitro was increased up to 10-fold. However, their efficiency of replication in the lower respiratory tracts of mice was statistically indistinguishable from that of the parental virus. In the upper respiratory tract, replication was slightly reduced on some days for viruses in which G was in the first position. The magnitude of the G-specific antibody response to the gene shift viruses was similar to that to the parental virus, whereas the F-specific response was increased up to fourfold, although this was not reflected in an increase of the neutralizing activity. Thus, shifting the G and F genes to the promoter-proximal position increased virus replication in vitro, had little effect on replication in the mouse, and increased the antigen-specific immunogenicity of the virus beyond that of parental RSV.


Figures

FIG. 1.
FIG. 1.
Shift of the G or F gene individually or together to a promoter-proximal position(s) in the RSV genome. The diagram at the top illustrates the wild-type RSV genome from which the SH gene had been deleted and in which a BlpI restriction site had been inserted immediately upstream of the NS1 ORF to create Blp/ΔSH. The box underneath and on the left illustrates the insertion of the G gene alone, the F gene alone, or the G and F genes together into the BlpI site of Blp/ΔSH to create G1/ΔSH, F1/ΔSH, and G1F2/ΔSH, respectively. The creation of the BlpI site involved two nucleotide substitutions, and the original assignments are shown in lowercase below the underlined site. To create the G or F single-gene insert, the complete G or F ORF (each illustrated by an open rectangle with the translational initiation codon indicated) with the downstream noncoding region and GE signal (illustrated by a shaded box) was engineered to be followed by a hexanucleotide intergenic sequence (CATATT or CACAAT, identical to the first 6 nt of the naturally occurring G-F or F-M2 IG sequence, respectively), followed by the NS1 GS signal. The G-F double-gene cDNA insert was constructed to contain (in upstream-to-downstream order) the complete G ORF, its downstream noncoding region and GE signal, the G-F IG sequence, the complete F gene, the above-mentioned hexanucleotide from the F-M2 IG, and the NS1 GS signal. All inserts are flanked by BlpI sites. The box on the right shows the details of the deletion of the gene(s) from the naturally occurring position(s), which was done leaving intact the indicated naturally occurring IG regions and without the addition of any heterologous sequence.
FIG. 2.
FIG. 2.
Comparison of plaque formation in HEp-2 (A) and Vero (B) cells by complete wild-type rRSV (rA2), rRSV from which the SH gene had been deleted (rA2/ΔSH), rRSV lacking the SH gene and containing the BlpI site (Blp/ΔSH), and the gene shift mutants G1/ΔSH, F1/ΔSH, and G1F2/ΔSH. Cell monolayers in six-well plates were infected with approximately 20 PFU of the indicated virus per well, incubated at 37°C under a methylcellulose overlay, and photographed without further treatment at 3 or 4 days postinoculation (d.p.i.), as indicated.
FIG. 3.
FIG. 3.
Single-step growth kinetics of the gene shift viruses in vitro. Duplicate monolayers of HEp-2 (A) or Vero (B) cells were infected with G1/ΔSH, F1/ΔSH, G1F2/ΔSH, or the parental virus Blp/ΔSH at an input MOI of 3 PFU per cell. Supernatants were harvested at the indicated time points and flash frozen, and virus titers were determined later by plaque assay. The mean virus titers from two independent experiments are shown.
FIG. 4.
FIG. 4.
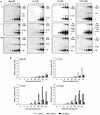
Northern blot analysis of intracellular transcription and RNA replication by the gene shift viruses. HEp-2 cells from the single-step growth kinetics experiment described in the legend to Fig. 3 were harvested, and total intracellular RNA was isolated and subjected to Northern blot analysis. Blots were hybridized with double-stranded DNA probes specific for G, F, or M2. (A) Autoradiograms of the Northern blots, with the virus and the time points in hours indicated on top, the probe indicated to the left, and the various viral bands identified to the right. The band marked full length is a mixture of genome and antigenome. (B) Quantitation of the G, F, and M2 mRNAs. The Northern blots were analyzed by phosphorimagery, and the amount of radioactivity in the bands of monocistronic mRNAs for G, F, or M2 and of polycistronic mRNAs with G, F, or M2 as the first ORF, respectively, were added and normalized with regard to the length of each probe and its content of C residues, representing the labeled nucleotide.
FIG. 5.
FIG. 5.
Analysis of the effects of the gene shifts on the polar gradient of gene transcription. HEp-2 cells were infected with Blp/ΔSH, G1/ΔSH, F1/ΔSH, or G1F2/ΔSH at an input MOI of 3 PFU per cell. After incubation at 37°C for16 or 20 h, cells were harvested and total RNA was isolated and subjected to Northern blot analysis with double-stranded DNA probes specific for each of the 10 RSV genes. Quantitation of the amount of each mRNA is shown as a percentage of the amount of M2 mRNA, calculated separately for each virus. In each gel lane, the amount of monocistronic mRNA and polycistronic mRNA with the respective gene represented as the first ORF was normalized to the band of genome-antigenome, or to the F mRNA in double-probed blots, as an internal standard and to the CMP content and length of the respective probe. Shown are the mean values from two independent experiments with two time points each.
FIG. 6.
FIG. 6.
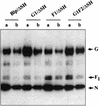
Western blot analysis of the expression of the G, F, and N proteins by the gene shift viruses. Aliquots of HEp-2 cells from the 20-h time point in the experiment described in the legend to Fig. 5 were lysed, and aliquots representing approximately 7.6 × 10³ (lanes a) and 3.8 × 10³ (lanes b) cells were subjected to Western blot analysis and detected with a mixture of polyclonal antisera against the RSV G and F and BRSV N proteins.

Similar articles

Cited by

References

    1. Atreya, P. L., M. E. Peeples, and P. L. Collins. 1998. The NS1 protein of human respiratory syncytial virus is a potent inhibitor of minigenome transcription and RNA replication. J. Virol. 72:1452-1461. - PMC - PubMed
    1. Ball, L. A., C. R. Pringle, B. Flanagan, V. P. Perepelitsa, and G. W. Wertz. 1999. Phenotypic consequences of rearranging the P, M, and G genes of vesicular stomatitis virus. J. Virol. 73:4705-4712. - PMC - PubMed
    1. Barik, S. 1992. Transcription of human respiratory syncytial virus genome RNA in vitro: requirement of a cellular factor(s). J. Virol. 66:6813-6818. - PMC - PubMed
    1. Beeler, J. A., and K. van Wyke Coelingh. 1989. Neutralization epitopes of the F glycoprotein of respiratory syncytial virus: effect of mutation upon fusion function. J. Virol. 63:2941-2950. - PMC - PubMed
    1. Bermingham, A., and P. L. Collins. 1999. The M2-2 protein of human respiratory syncytial virus is a regulatory factor involved in the balance between RNA replication and transcription. Proc. Natl. Acad. Sci. USA 96:11259-11264. - PMC - PubMed

Publication types

MeSH terms

LinkOut - more resources