

Impaired glucose phosphorylation and transport in skeletal muscle cause insulin resistance in HIV-1-infected patients with lipodystrophy
- PMID: 12417571
- PMCID: PMC151608
- DOI: 10.1172/JCI15626
Impaired glucose phosphorylation and transport in skeletal muscle cause insulin resistance in HIV-1-infected patients with lipodystrophy
Abstract
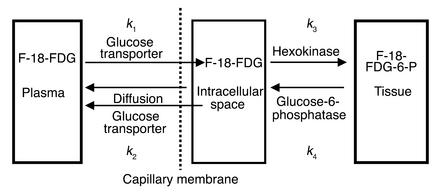
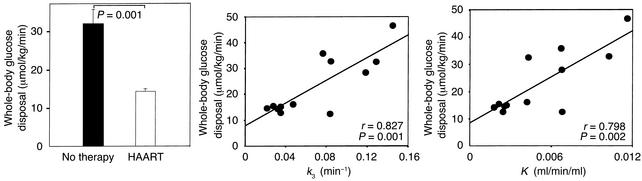
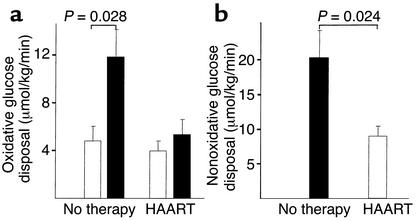
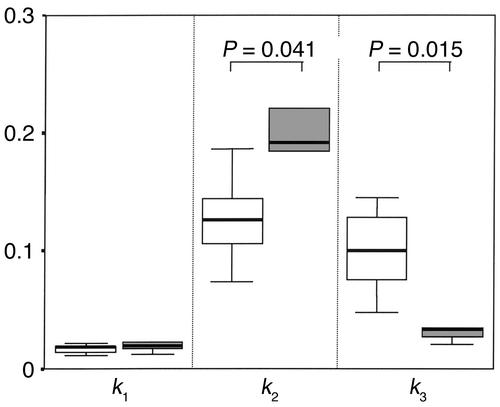
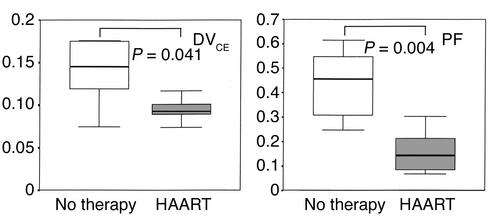
Insulin resistance is a frequently observed side effect of highly active antiretroviral therapy (HAART). Currently, very little is known about the mechanisms or specific tissues involved. We aimed to identify possible defects in skeletal muscle glucose uptake and metabolism in HIV patients receiving HAART. Whole-body glucose disposal and oxidation were determined by combination of the euglycemic-hyperinsulinemic clamp technique and indirect calorimetry. Muscle glucose uptake of the thighs was measured simultaneously by dynamic 2[(18)F]fluoro-2-deoxy-D-glucose positron emission tomography. Patients receiving HAART had signs of lipodystrophy as confirmed by dual energy x-ray absorptiometry. Whole-body glucose disposal was significantly reduced in these patients compared with untreated patients. Analysis of kinetic constants using a three-compartment model indicated reduced skeletal glucose uptake caused by significantly impaired glucose transport and phosphorylation. Skeletal muscle glucose uptake was reduced by 66% in treated patients and explained 46% and 43% of whole-body glucose disposal in patients on HAART and therapy-naive patients, respectively. Insulin-stimulated whole-body oxidative and nonoxidative glucose disposal was significantly lower in the treated group, as was suppressive insulin action on lipolysis. To our knowledge, this is the first report providing in vivo evidence that, in lipodystrophic HIV patients, impaired glucose transport and phosphorylation cause reduced insulin-mediated glucose uptake.
Figures
References
-
- Carr A, et al. Diagnosis, prediction, and natural course of HIV-1 protease inhibitor-associated lipodystrophy, hyperlipidaemia, and diabetes mellitus: a cohort study. Lancet. 1999;353:2093–2099. - PubMed
-
- Behrens G, Stoll M, Schmidt RE. Lipodystrophy syndrome in HIV infection: what is it, what causes it and how can it be managed? Drug Saf. 2000;23:57–76. - PubMed
-
- Behrens G, et al. Impaired glucose tolerance, beta cell function and lipid metabolism in HIV patients under treatment with protease inhibitors. AIDS. 1999;13:F63–F70. - PubMed
-
- Walli R, et al. Treatment with protease inhibitors associated with peripheral insulin resistance and impaired oral glucose tolerance in HIV-1-infected patients. AIDS. 1998;12:F167–F173. - PubMed
-
- Behrens G, Schmidt H, Meyer D, Stoll M, Schmidt RE. Vascular complications associated with use of HIV protease inhibitors. Lancet. 1998;351:1958. - PubMed
