. 2002 Nov 11;159(3):441-52.
doi: 10.1083/jcb.200203150. Epub 2002 Nov 4.

Visualization of the intracellular behavior of HIV in living cells

Affiliations

Visualization of the intracellular behavior of HIV in living cells

David McDonald et al. J Cell Biol. .

Abstract

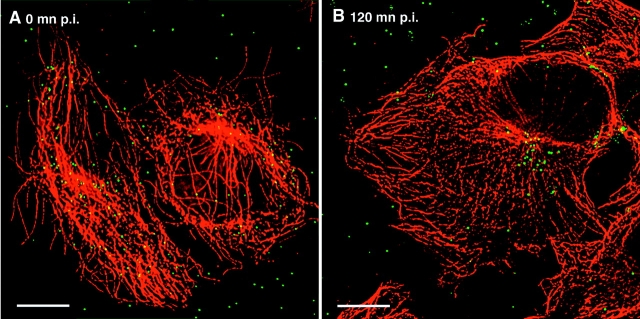
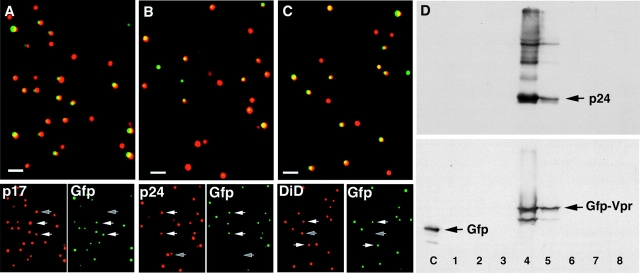
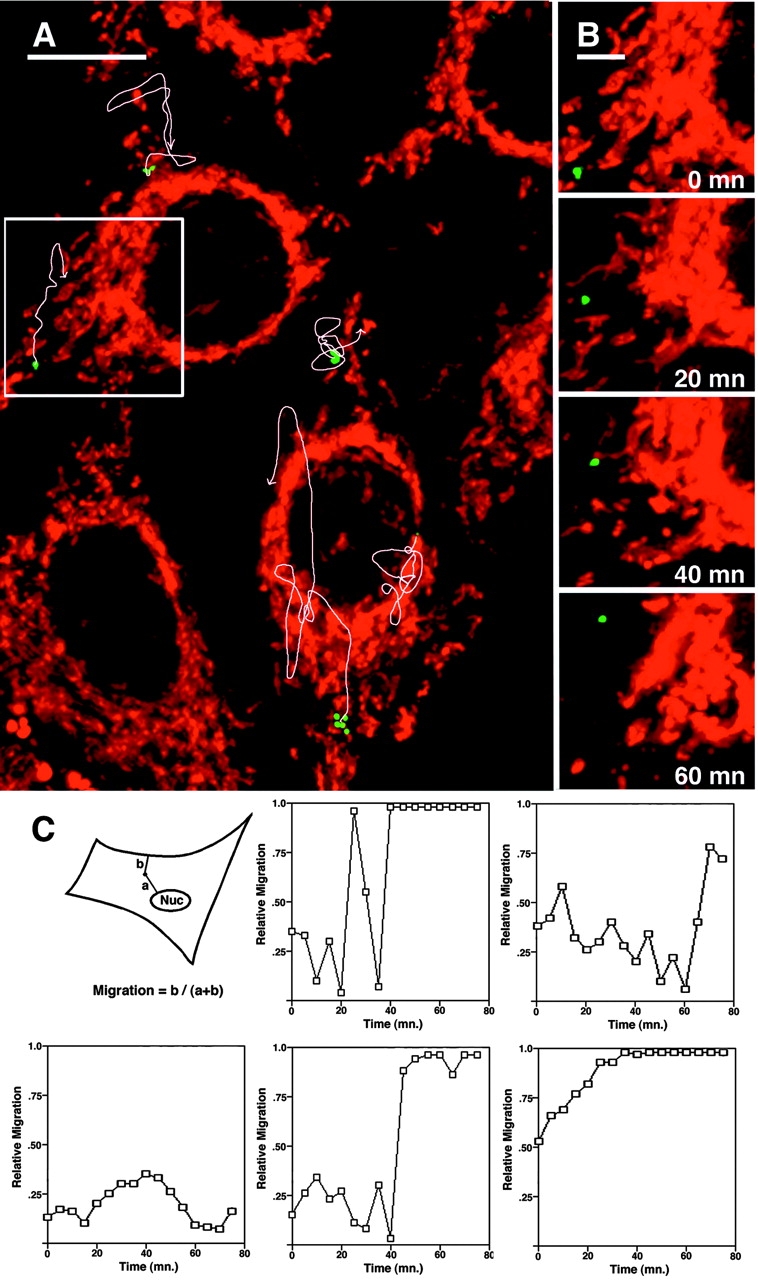
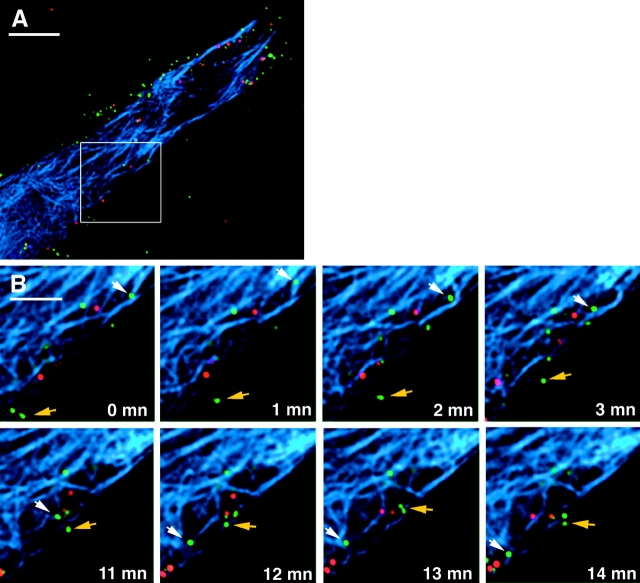
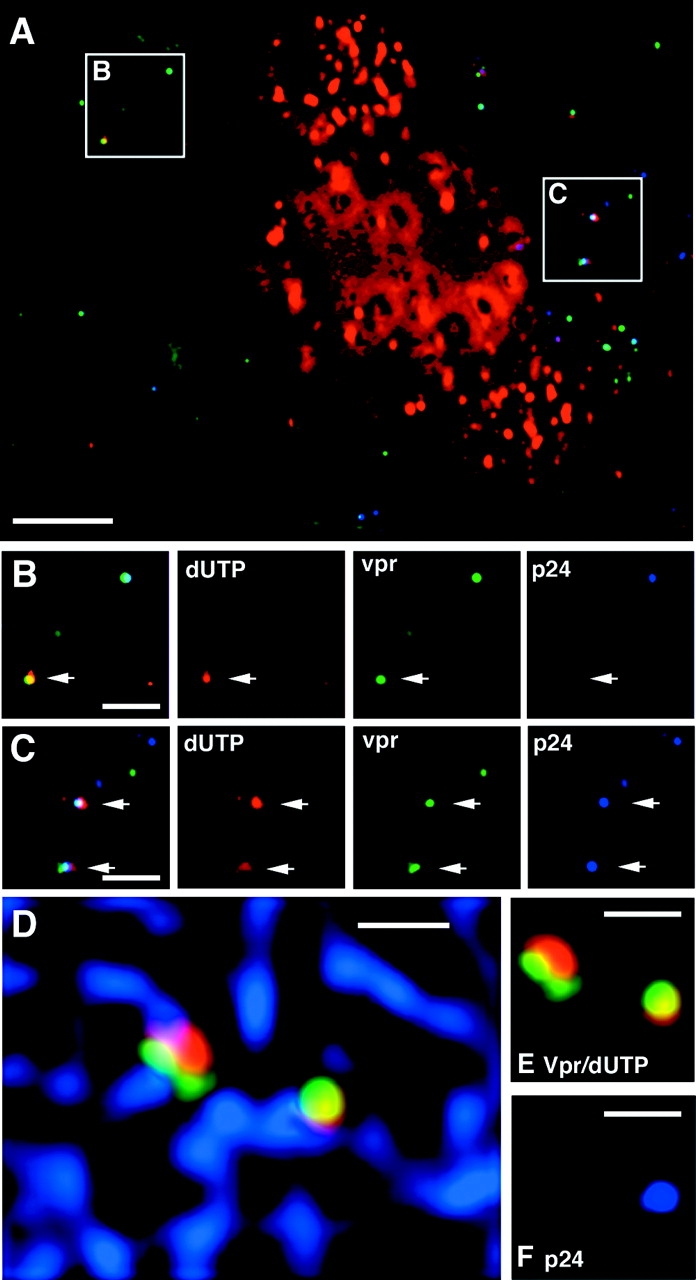
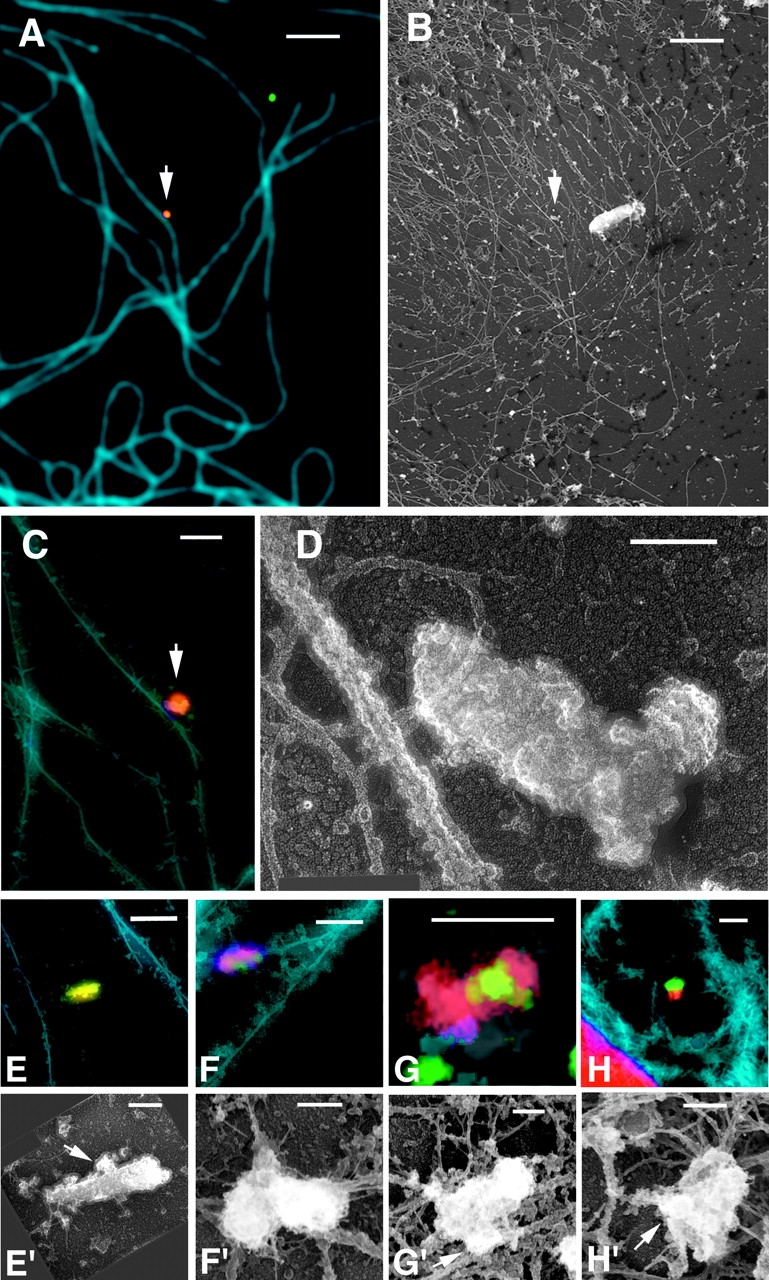
To track the behavior of human immunodeficiency virus (HIV)-1 in the cytoplasm of infected cells, we have tagged virions by incorporation of HIV Vpr fused to the GFP. Observation of the GFP-labeled particles in living cells revealed that they moved in curvilinear paths in the cytoplasm and accumulated in the perinuclear region, often near the microtubule-organizing center. Further studies show that HIV uses cytoplasmic dynein and the microtubule network to migrate toward the nucleus. By combining GFP fused to the NH2 terminus of HIV-1 Vpr tagging with other labeling techniques, it was possible to determine the state of progression of individual particles through the viral life cycle. Correlation of immunofluorescent and electron micrographs allowed high resolution imaging of microtubule-associated structures that are proposed to be reverse transcription complexes. Based on these observations, we propose that HIV uses dynein and the microtubule network to facilitate the delivery of the viral genome to the nucleus of the cell during early postentry steps of the HIV life cycle.


Figures

Figure 1.
Figure 1.
Infection with EGFP–Vpr-labeled HIV results in perinuclear accumulation of point sources of Gfp fluorescence. Supernatant of 293T cells transfected with pLAI proviral and GFP–Vpr expression plasmids was collected, filtered through a 0.4-μm membrane, and transferred onto coverslips seeded with CD4-expressing target cells for 30 min at 37°C. Cells were rinsed and fixed in formaldehyde (A) or incubated for an additional 2 h (B) and fixed, then immunostained with an antitubulin antibody (red). GFP fluorescence is shown in green. Bars, 10 μm.
Figure 2.
Figure 2.
EGFP–Vpr colocalizes with viral gag proteins and cell-derived membranes. (A and B) GFP–Vpr colocalizes with HIV gag proteins. Supernatant from cells transfected with GFP–Vpr and pLAI proviral constructs was exposed to clean glass coverslips in the presence of 10 μg/ml Polybrene. Coverslips were rinsed, fixed, and immunostained with mAbs specific to p17MA (A) and p24CA (B). Top panels are the merged images so that overlapping red and green signals appear yellow. Bottom panels show the individual fluorescent images. White arrows denote double labeled particle; the gray arrow shows a single labeled (GFP-negative) particle. (C) GFP–Vpr colocalizes with cellular membranes. GFP–Vpr-labeled virus was prepared as in A with the addition of DiD (10 μM; Molecular Probes) to the culture medium overnight. Free DiD was washed from the culture, and supernatant was collected 4 h later, bound to a coverslip as above, and fixed with formaldehyde. Bottom panels are separated color images. (D) GFP–Vpr is incorporated into intact HIV virions. Supernatant was collected after transfection of 293T cells with GFP–Vpr, pLAI ∂env provirus, and VSV-G constructs. Virions were pelleted by centrifugation through a 20% sucrose cushion and applied to an Optiprep density gradient. Fractions were collected over the entire gradient, precipitated with 10% TCA, and subjected to SDS-PAGE and Western blotting with antibodies specific to p24CA (top) or GFP (bottom). A whole cell lysate of cells transfected with GFP was run as a control (lane C). Bars, 1 μm.
Figure 3.
Figure 3.
Movement of GFP–Vpr-tagged HIV particles in living cells. (A) HeLa/CD4/CCR5 cells were infected with GFP–Vpr-labeled HIV (Bru3 env, MOI <1) (green) for 30 mn at 23°C, stained with MitoTracker (red), and mounted in a live cell chamber for observation at 37°C. 14 0.5-μm optical z-sections were acquired every 5 mn for 95 min and rendered in single three-dimensional volume views. Oval areas without mitochondrial signal are the nuclei of the cells. Individual HIV particles appear as several spots in some cases due to short rapid movement during acquisition of the z-series. The image is of the first time point, and white arrows denote the trajectories of four different particles over time. (B) Four time points depict the progression of the particle in the inset box. (C) Quantification of GFP–Vpr-tagged HIV movement. HeLa/CD4 cells were infected for 20 min with GFP–Vpr-labeled HIV, washed, and imaged every 5 min. Particle position was measured at each time point, and relative nuclear migration is expressed as the fractional distance from the cell periphery to the nucleus (see diagram) so that low values represent peripheral localization and high values represent perinuclear localization. The five graphs track the movement of representative particles. Bars: (A) 10 μm; (B) 4 μm. See also videos 1 and 2 available at http://www.jcb.org/cgi/content/full/jcb.200203150/DC1.
Figure 4.
Figure 4.
Microtubule-dependent and -independent movement of HIV particles in living cells. Hos/CD4 cells were microinjected with rhodamine-tubulin (Cytoskeleton) and incubated for 1 h at 37°C to label microtubules (blue), spinfected with GFP–Vpr (green), and DiD (red)-labeled HIV Bru3 for 1 h at 1,200 g, 23°C. The cells were washed and placed in medium supplemented with 50 mM Hepes and 0.1 μM taxol to maintain microtubule structure. Images were collected every minute in the three color spectra at 37°C. (A) Cell at the beginning time point. Nucleus is to the lower left, out of frame. (B) Two time segments depicting microtubule- dependent (white arrow) and -independent (colored arrow) movement of DiD-negative particles. The particle on microtubules appears to be the same in both time segments, although assignment is ambiguous in one intermediate frame so that this could represent two independent particles moving on microtubules. See also videos 1 and 2 available at http://www.jcb.org/cgi/content/full/jcb.200203150/DC1. Bars: (A) 10 μm; (B) 5 μm.
Figure 5.
Figure 5.
Inhibition of dynein motor activity results in peripheral localization of HIV particles. (A) Cells were microinjected with antidynein IC74 mAb (1.5 mg/ml) and rhodamine-dextran marker (cell outlined in blue; white outlines are uninjected cells), infected for 1 h with DiD (red)-labeled GFP–Vpr-labeled HIV (green) at 37°C, and then fixed. (B and C) Magnification of boxed regions. Arrows show GFP-positive, DiD-negative particles in the perinuclear region of the uninjected cell (B) and peripheral region of the injected cell (C). (D) Quantification of DiD-negative particle progression toward the nucleus. Relative migration is calculated as described in Fig. 3. The graph represents the majority of particles in uninjected (none) and injected (IC74) cells from A. Bars, 10 μm.
Figure 6.
Figure 6.
Deoxynucleotide labeling of cytoplasmic reverse transcription complexes. (A) Target cells expressing CD4 were injected with Alexa–dUTP (red) (1mM in PBS; Molecular Probes), infected with GFP–Vpr-labeled HIV (green) (MOI ∼10) for 2 h at 37°C, washed and incubated 2 h more before fixation. Microtubules (blue) were stained with antitubulin antibody. Large arrow denotes the MTOC, and small arrows show viral particles, which have incorporated the Alexa–dUTP. (B and C) Magnification of the MTOC region. Note the overlap of green (GFP) and red (dUTP) signals in the two particles, resulting in yellow color. Bars: (A) 10 μm; (B and C) 2 μm.
Figure 7.
Figure 7.
Inhibition of dynein motor activity results in reduced nuclear migration of HIV RTCs. (A and B) Hos/CD4/CCR5 cells were coinjected with Alexa–dUTP (0.5 mM) mixed with an isotype-matched IgG mAb (Control) or antidynein mAb (IC74), and infected with GFP–Vpr-labeled HIVYu (MOI ∼10) for 2 h at 37°C; medium was refreshed, and cells were incubated an additional 2 h. Cytoplasmic RTCs were identified, and their nuclear progression was quantified as in the legend to Fig. 3. Columns are average values ± SEM of four independent experiments. n, the total number of RTCs quantified. (B) The average number of RTCs/cell from the experiments described in A. Columns are the average number ± SEM. n, the number of cells evaluated.
Figure 8.
Figure 8.
Some HIV reverse transcription complexes contain p24CA protein. Hos cells that express CD4 and CCR5 were injected with Alexa–dUTP (red) and infected with GFP–Vpr-labeled YU strain of HIV (green) (MOI ∼10) for 4 h, fixed, and stained with p24CA antibody. (A) Perinuclear region of a cell with some nuclear incorporation of Alexa–dUTP. (B) Merged (left) and individual color images of a p24CA-negative RTC. Note the presence (top right) of a dUTP-negative, p24CA-positive particle. (C) Merged and individual images of p24CA-positive RTCs. (D) p24CA-positive and -negative RTCs associate with microtubules. Microtubules (blue) were stained in addition to p24CA, and images were collected in four color spectra. (E) Shows the same two RTCs without microtubules, and (F) shows the p24CA (blue) staining profile. Bars: (A) 5 μm; (B–F) 2 μm.
Figure 9.
Figure 9.
Electron microscopic analysis of cytoplasmic RTC structure. Fibroblasts were injected with Alexa–dUTP (red) and infected with GFP–Vpr-labeled VSV-G pseudotyped HIV (MOI ∼50–100, green) for 4 h. Cell membranes were extracted with 1% Triton X-100 containing taxol, actin was depleted by gelsolin treatment, and the cells were washed, fixed, and immunostained with an antitubulin mAb (blue). Cells were imaged with a fluorescence microscope and then processed for Pt rotary shadowing and relocated on the electron microscope. Microtubules with associated RTC (arrow) in immunofluorescent (A) and electron microscopic (B) images were aligned and overlayed (C). (D) High magnification image of the RTC in A–C. Immunofluorescent (E–H) and EM images (E'–H') of four RTCs, three of which (F–H) appear to be tethered to microtubules. Bars: (A and B) 10 μm; (C and E–H) 1 μm; (D and E'–H') 0.1 μm.

Comment in

References

    1. Accola, M.A., A. Ohagen, and H.G. Gottlinger. 2000. Isolation of human immunodeficiency virus type 1 cores: retention of Vpr in the absence of p6(gag). J. Virol. 74:6198–6202. - PMC - PubMed
    1. Andreadis, S., T. Lavery, H.E. Davis, J.M. Le Doux, M.L. Yarmush, and J.R. Morgan. 2000. Toward a more accurate quantitation of the activity of recombinant retroviruses: alternatives to titer and multiplicity of infection. J. Virol. 74:1258–1266. - PMC - PubMed
    1. Bartz, S.R., and M.A. Vodicka. 1997. Production of high-titer human immunodeficiency virus type 1 pseudotyped with vesicular stomatitis virus glycoprotein. Methods. 12:337–342. - PubMed
    1. Bukrinskaya, A., B. Brichacek, A. Mann, and M. Stevenson. 1998. Establishment of a functional human immunodeficiency virus type 1 (HIV-1) reverse transcription complex involves the cytoskeleton. J. Exp. Med. 188:2113–2125. - PMC - PubMed
    1. Cullen, B.R. 2001. Journey to the center of the cell. Cell. 105:697–700. - PubMed

Publication types

MeSH terms