. 2002 Nov 1;22(21):9244-54.
doi: 10.1523/JNEUROSCI.22-21-09244.2002.

Pituitary adenylate cyclase-activating polypeptide and sonic hedgehog interact to control cerebellar granule precursor cell proliferation

Affiliations

Pituitary adenylate cyclase-activating polypeptide and sonic hedgehog interact to control cerebellar granule precursor cell proliferation

Arnaud Nicot et al. J Neurosci. .

Abstract

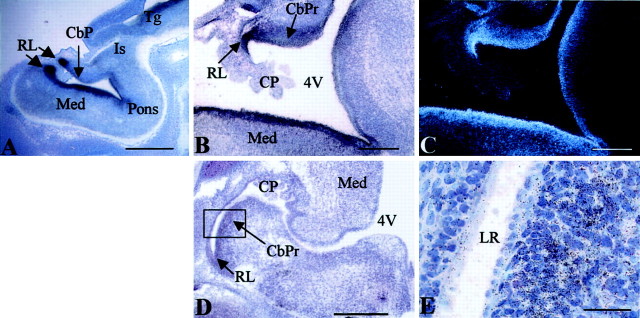
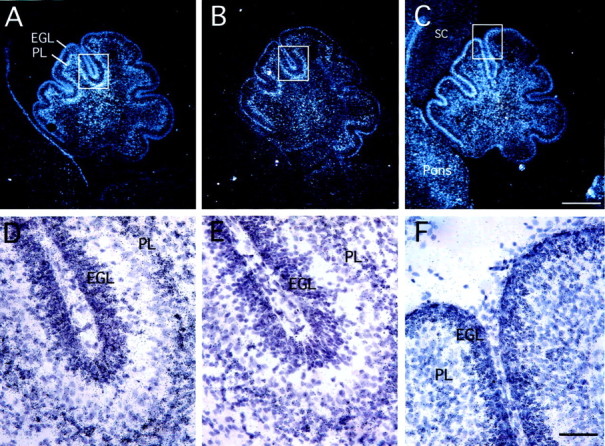
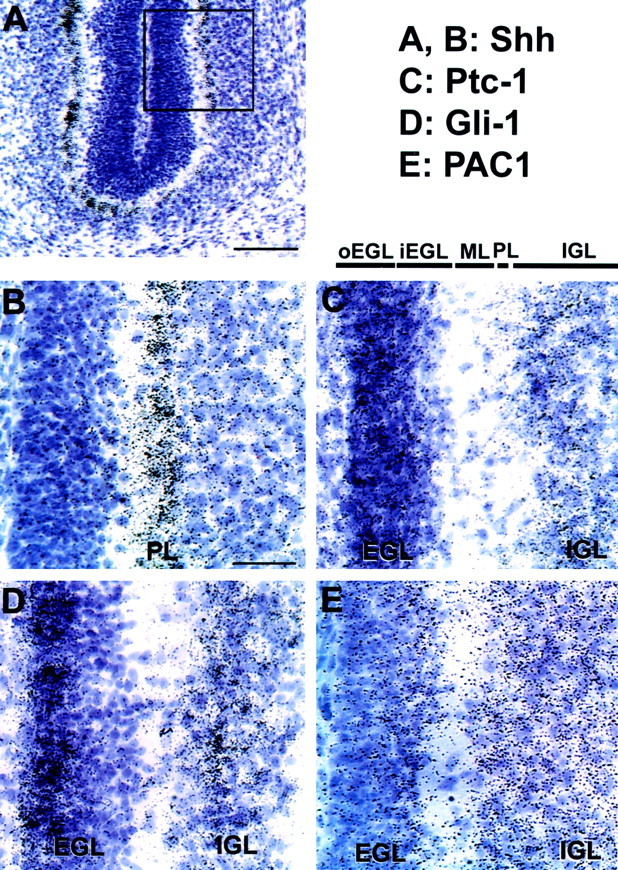
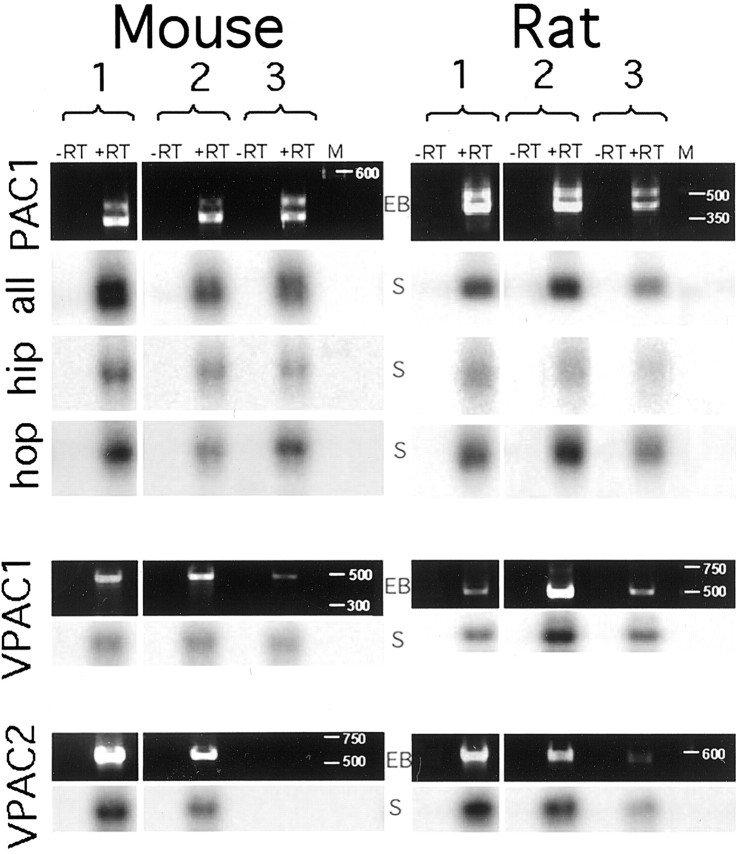
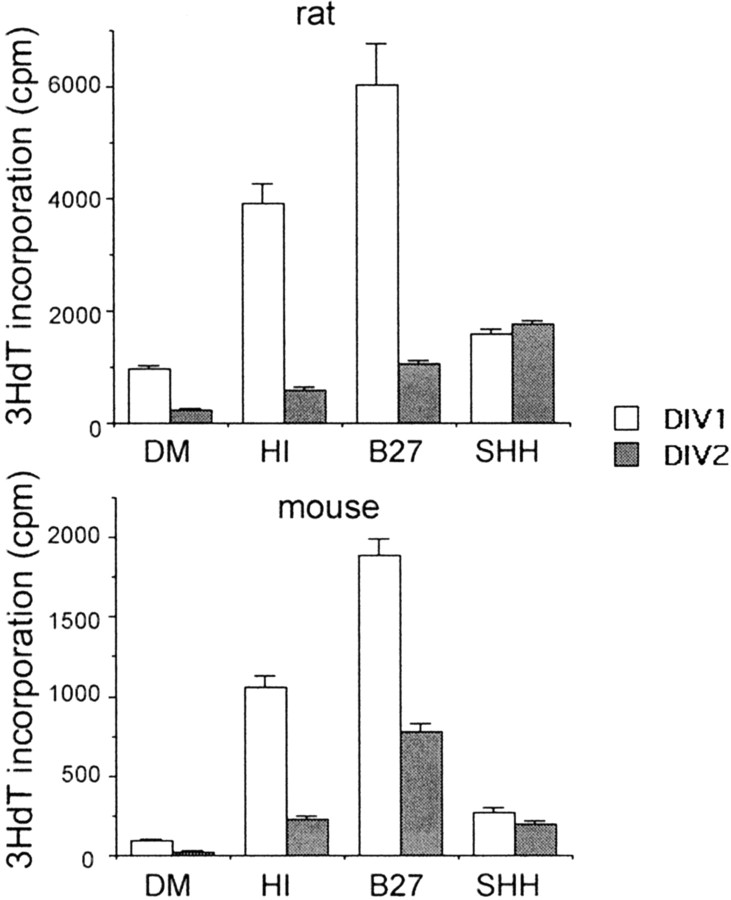
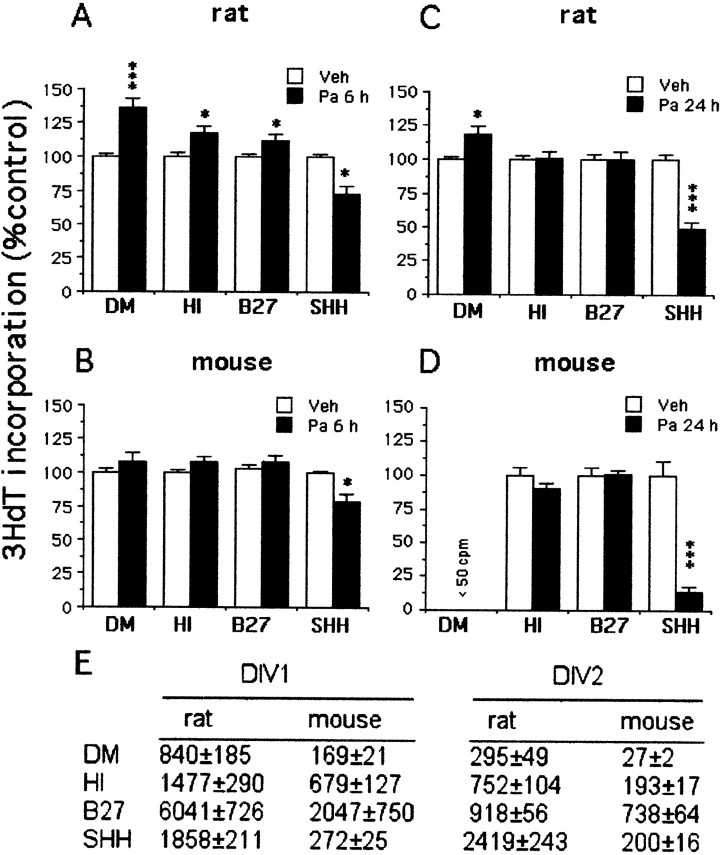
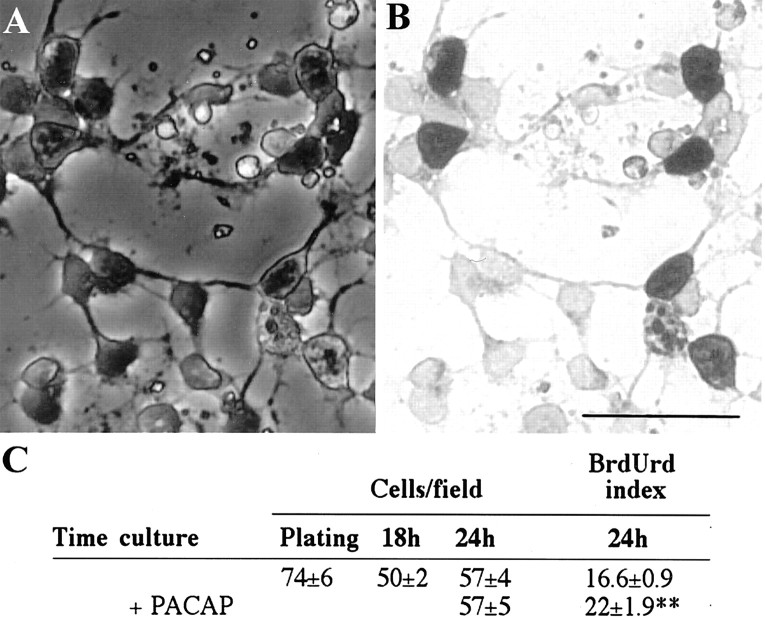
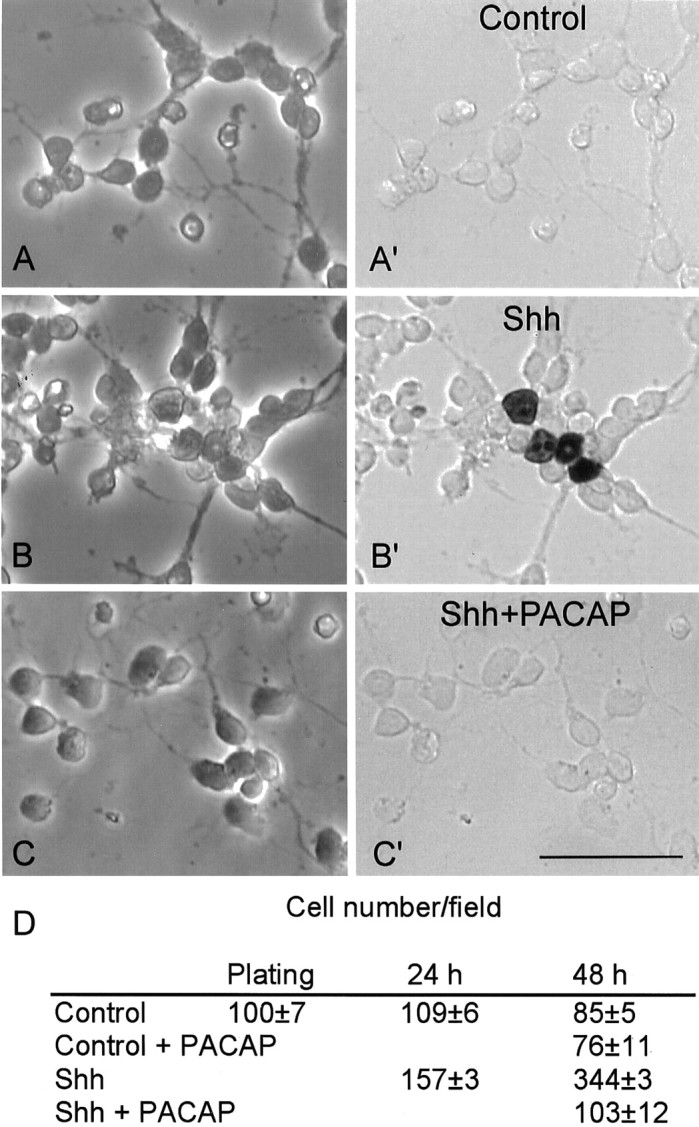
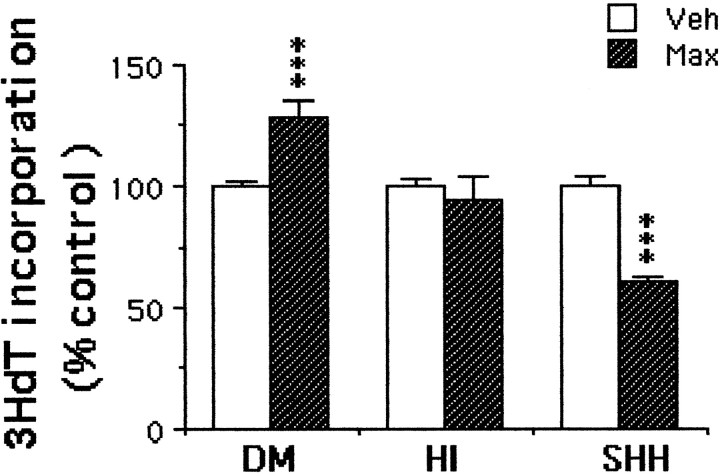
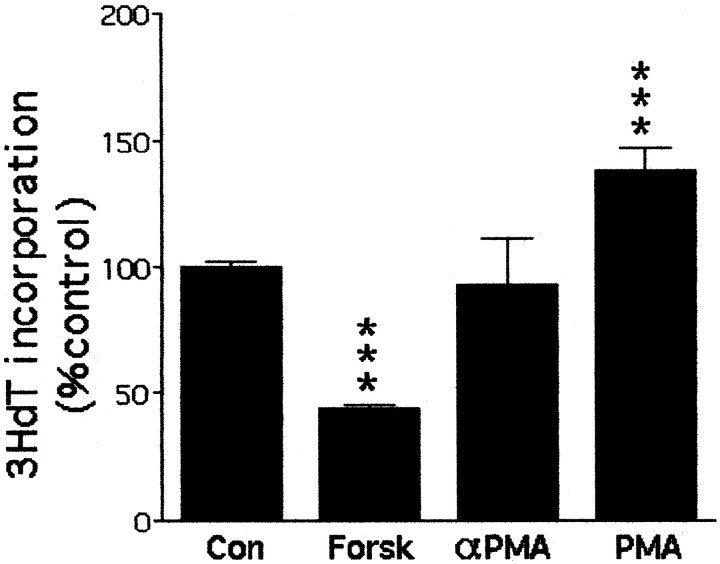
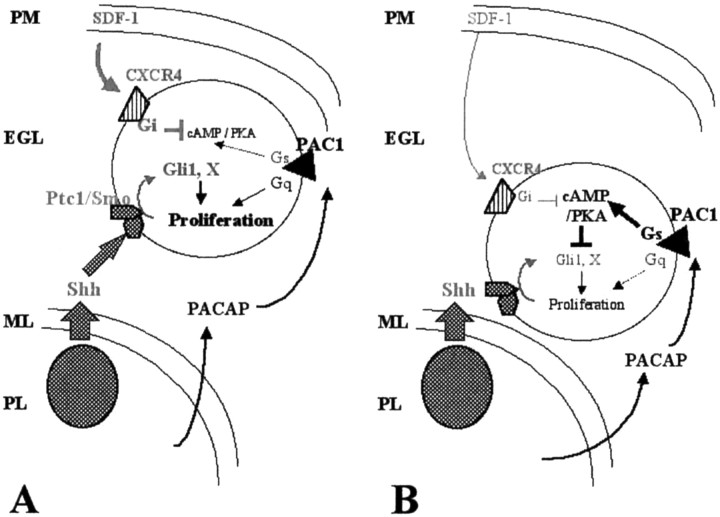
Although positive and negative signals control neurogenesis in the embryo, factors regulating postnatal proliferation are less well characterized. In the vertebrate cerebellum, Sonic Hedgehog (Shh) is an efficacious mitogen for cerebellar granule neuron precursors (GNPs), and mutations activating the Shh pathway are linked to medulloblastoma, a tumor derived from GNPs. Although the mitogenic effects of Shh can be blocked by increasing cAMP or protein kinase A activity, the physiological factors antagonizing this stimulation are undefined. In the embryo, pituitary adenylate cyclase-activating polypeptide (PACAP) receptor 1 (PAC1) signaling regulates neural precursor proliferation. We now show that in the developing cerebellum, PAC1 mRNA colocalizes with gene transcripts for Shh receptor Patched 1 and target gene Gli1 in the external germinal layer. We consequently investigated the interactions of PACAP and Shh in proliferation of purified GNPs in culture. Shh exhibited mitogenic activity in both rat and mouse cultures, stimulating DNA synthesis approximately 10-fold after 48 hr of exposure. PACAP markedly inhibited Shh-induced thymidine incorporation by 50 and 85% in rat and mouse GNPs, respectively, but did not significantly affect the stimulation induced by other mitogens. This selective effect was reproduced by the specific PAC1 agonist maxadilan, as well as by the adenylate cyclase activator forskolin, suggesting that PAC1 provides a potent inhibitory signal for Shh-induced proliferation in developing cerebellum. In contrast, in the absence of Shh, PACAP and maxadilan modestly stimulated DNA synthesis, an effect reproduced by activating protein kinase C. These observations suggest that G-protein-coupled receptors, such as PAC1, serve as sensors of environmental cues, coordinating diverse neurogenetic signals.


Figures

Fig. 1.
Fig. 1.
PAC1 receptor and PACAP ligand gene expression during embryonic development detected by in situ hybridization. A, Bright-field micrograph showing PAC1 gene expression in the hindbrain ventricular zone and rhombic lip (RL) but absent in the cerebellar plate (CbP) in a sagittal section from an E12.5 mouse. Scale bar, 1 mm. B, C, Micrographs showing PAC1 gene expression in E14.5 hindbrain and cerebellar area sagittal sections. B, Bright field; C, corresponding dark field. Scale bars, 500 μm. D,E, In situ hybridizations (bright fields) showing PACAP gene expression in a transverse hemisection at the level of the cerebellar primordium at E14.5. E, Higher-power micrograph from the box in D. Scale bars:D, 500 μm; E, 25 μm. No significant hybridization signals were seen with sense probes. CbP, Cerebellar plate; CbPr, cerebellar primordium;CP, choroid plexus; Is, isthmus;LR, lateral recess of fourth ventricle;Med, medulla; RL, rhombic lip;Tg, tegmentum; 4V, fourth ventricle.
Fig. 2.
Fig. 2.
Localization of Ptc1 (A,D), Gli1 (B, E), and PAC1 (C, F) gene expression in postnatal day 1 rat brain by in situ hybridization. Dark-field photomicrographs of sagittal sections of cerebellum are shown in A–C (scale bar, 500 μm). Bright-field views of corresponding boxes at higher magnification are shown in D–F (scale bar, 50 μm). PL, Purkinje cell layer; SC, spinal cord.
Fig. 3.
Fig. 3.
Localization of Shh (A,B), Ptc1 (C), Gli1 (D), and PAC1 (E) gene expression in postnatal days 5–6 rat brain by in situhybridization. A, Bright-field photomicrograph of a sagittal cerebellar section (scale bar, 100 μm). This section has been hybridized with the Shh probe, which localizes to the Purkinje layer. The box indicates the position of the bright-field views at higher magnification in B–E(scale bar, 35 μm). ML, Molecular layer;PL, Purkinje cell layer.
Fig. 4.
Fig. 4.
Expression of PAC1, VPAC1, and VPAC2 receptors by cells isolated from postnatal mouse and rat cerebellum defined by RT-PCR. Total RNA was extracted from embryonic cerebral cortex (1) or from glial/Purkinje cell (2) and granule cell (3) fractions of P6–P7 mouse and rat cerebellum and subjected to RT-PCR. Results in mouse fractions (left side) are compared with E13.5 mouse cortex. Results in rat (right side) are compared with E14.5 rat cortex. Shown for each receptor is the ethidium bromide-stained gel (EB) and the Southern blot analyses directly below (S) using PAC1 splice variant-, VPAC1-, and VPAC2-specific internal probes. For PAC1, both the short isoform (bottom band, 430 bp) and the hop isoform (top band, 460 bp) were detected, whereas the hip insert was barely detected by Southern blot. For VPAC1 and VPAC2, only one mRNA form was detected (480 and 545 bp bands, respectively). RT-PCRs performed in the absence of reverse transcriptase (−RT) are shown as an indicator of absence of genomic DNA contamination. Band sizes were estimated using commercially available DNA ladder (M).
Fig. 5.
Fig. 5.
Effect of medium composition on rat and mouse GNP DNA synthesis. GNPs from P6 to P7 rat or mouse cerebella were cultured at 3 × 10⁵ cells per well for 24 hr (DIV1) or 48 hr (DIV2) in DM or DM supplemented with 5 μg/ml insulin (HI), 2% B27 (B27), or 3 μg/ml Shh (SHH). Cultures were exposed to [3H]dT during the final 2 hr of culture to assess DNA synthesis. Although HI and B27 media at DIV1 markedly stimulated [3H]dT incorporation, longer exposure (DIV2) resulted in lower counts. In contrast, Shh elicited a moderate but sustained increase in GNP mitotic activity on both DIV1 and DIV2. Values are expressed as mean counts per minute per well ± SEM (6–12 wells per group).
Fig. 6.
Fig. 6.
Effects of PACAP treatment on DNA synthesis. Purified P6–P7 cerebellar GNPs were plated at 250,000 cells per well in various media. The next day (DIV1), cells were treated with 10 nm PACAP (Pa) or vehicle (Veh) for 6 hr (A, B) or 24 hr (DIV2) (C, D). Cultures were pulsed with [3H]dT for the final 2 hr and processed for [3H]dT incorporation. A, PACAP treatment stimulated rat GNP mitosis in DM (no mitogen), DM plus insulin (5 μg/ml) (HI), and B27-supplemented medium (B27), whereas the peptide slightly reduced Shh-induced [3H]dT incorporation.B, In mouse cultures, PACAP was not sufficient to stimulate GNP mitosis but reduced Shh-induced [3H]dT incorporation by 20%. C, PACAP treatment slightly stimulated rat GNP mitosis in DM, whereas the peptide reduced Shh-mediated proliferation by 50%. D, In mouse cultures, PACAP was not sufficient to maintain GNP proliferation in DM (<50 cpm in both controls and treated groups). However, in the presence of Shh, PACAP inhibited mitosis by 85%. Data are expressed as a percentage of vehicle control for each medium (9–12 wells per group). ∗p < 0.05; ∗∗∗p < 0.001. E, counts per minute values from control cultures (vehicle treated) are indicated as mean ± SEM (n = 3–4 independent experiments for each medium).
Fig. 7.
Fig. 7.
PACAP stimulates BrdU labeling. P7 rat cells were cultured for 24 hr in DM and exposed to 10 nm PACAP for the final 6 hr. After a pulse of 10 μm BrdU for the final 4 hr, cells were processed for BrdU immunocytochemistry.A, B, Cells are visualized by phase (A) or bright-field (B) microscopy after immunocytochemical staining. Cells were counted in five random fields per dish at 3, 18, and 24 hr of culture (5 dishes per group), and data are presented in a table (C). PACAP treatment did not affect cell number but increased BrdU (BrdUrd) labeling index, indicating that PACAP treatment for 6 hr increased S phase entry independent of possible survival effects. Cell number per field in corresponding cultures and BrdU index are expressed as mean ± SEM. ∗∗p < 0.01, PACAP effect. Scale bar, 35 μm.
Fig. 8.
Fig. 8.
PACAP inhibits BrdU labeling in Shh-treated GNPs. Phase-contrast (A–C) and bright-field (A′–C′) photographs of cells after BrdU immunocytochemistry. P7 mouse cells were cultured for 2 d in defined medium (Control) (A,A′) or defined medium with 3 μg/ml Shh (B, B′). C, C′, Shh-treated cells exposed to 10 nm PACAP for the last 24 hr. Cultures were pulsed with 10 μm BrdU for the final 4 hr and processed for BrdU immunocytochemistry. D, Cell number per field in corresponding cell cultures expressed as mean ± SEM. Scale bar, 35 μm.
Fig. 9.
Fig. 9.
Effect of the PAC1-selective agonist maxadilan on GNP DNA synthesis. Rat (P7) cells were incubated in DM, DM plus insulin (5 μg/ml) (HI), or Shh (3 μg/ml) (SHH) for 16 hr and treated for an additional 24 hr with 10 nm maxadilan (Max). Cultures were pulsed with [3H]dT for the final 2 hr and processed for [3H]dT incorporation. Data are expressed as a percentage of control (Veh, vehicle). Data are derived from two to three experiments (8–12 wells per group). ∗∗∗p < 0.001.
Fig. 10.
Fig. 10.
Opposing effects of adenylate cyclase and phospholipase C pathways on DNA synthesis. P6–P7 mouse cells were cultured in the presence of high insulin for 16 hr and treated for 6 hr with 30 μm forskolin (Forsk), vehicle (Con, control; 0.05% DMSO, 0.05% ethanol), phorbol ester PMA (0.2 μm), or inactive enantiomer αPMA. Cultures were pulsed with [3H]dT for the final 2 hr and processed for [3H]dT incorporation. Data are expressed as a percentage of vehicle (9 wells per group). ∗∗∗p < 0.001 versus control.
Fig. 11.
Fig. 11.
Model of PACAP regulation of granule precursor proliferation. Granule precursors are depicted in the outer EGL (A) and inner EGL (B), with the complex of soluble, extracellular signals and their receptors, including Shh/Ptc-Smo, SDF-1/CXCR4, and PACAP/PAC1 (adapted from Klein et al., 2001). A, Near the pia matter during the first postnatal week, granule cell proliferation is high. Prominent expression of SDF-1/CXCR4 blocks adenylate cyclase activity and cAMP via Gαi coupling, thereby promoting Shh-induced proliferation. PAC1 activation may moderately stimulate mitogenesis via the Gq/phospholipase C/protein kinase C pathway. B, In the inner EGL as development progresses, SDF-1 and CXCR4 levels decrease. In turn, the proliferative action of Shh is now blocked by PACAP via Gs activation of adenylate cyclase through PAC1 (and possibly VPAC1) receptors. PACAP may be derived from nerve fibers emerging from the Purkinje layer or brainstem nuclei. ML, Molecular layer;PL, Purkinje cell layer; PM, pia matter.

Similar articles

Cited by

References

    1. Akimaru H, Chen Y, Dai P, Hou DX, Nonaka M, Smolik SM, Armstrong S, Goodman RH, Ishii S. Drosophila CBP is a co-activator of cubitus interruptus in hedgehog signalling. Nature. 1997;386:735–738. - PubMed
    1. Alder J, Cho NK, Hatten ME. Embryonic precursor cells from the rhombic lip are specified to a cerebellar granule neuron identity. Neuron. 1996;17:389–399. - PubMed
    1. Altman J, Bayer SA. Development of the cerebellar system in relation to its evolution, structure and functions. CRC; New York: 1996.
    1. Arimura A. Perspectives on pituitary adenylate cyclase activating polypeptide (PACAP) in the neuroendocrine, endocrine, and nervous systems. Jpn J Physiol. 1998;48:301–331. - PubMed
    1. Barnes EA, Kong M, Ollendorff V, Donoghue DJ. Patched1 interacts with cyclin B1 to regulate cell cycle progression. EMBO J. 2001;20:2214–2223. - PMC - PubMed

Publication types

MeSH terms

Substances