. 2002 Nov 1;22(21):9430-44.
doi: 10.1523/JNEUROSCI.22-21-09430.2002.

Neuronal activity regulates correlated network properties of spontaneous calcium transients in astrocytes in situ

Affiliations

Neuronal activity regulates correlated network properties of spontaneous calcium transients in astrocytes in situ

Fernando Aguado et al. J Neurosci. .

Abstract

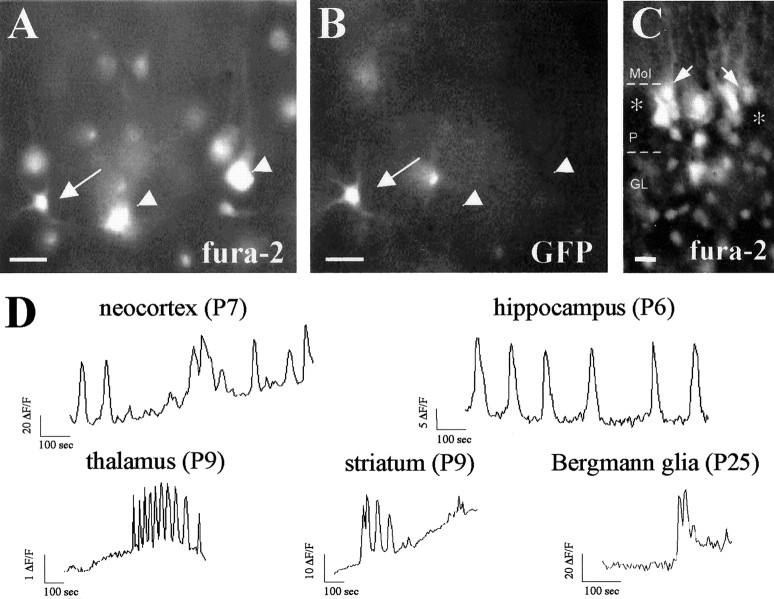
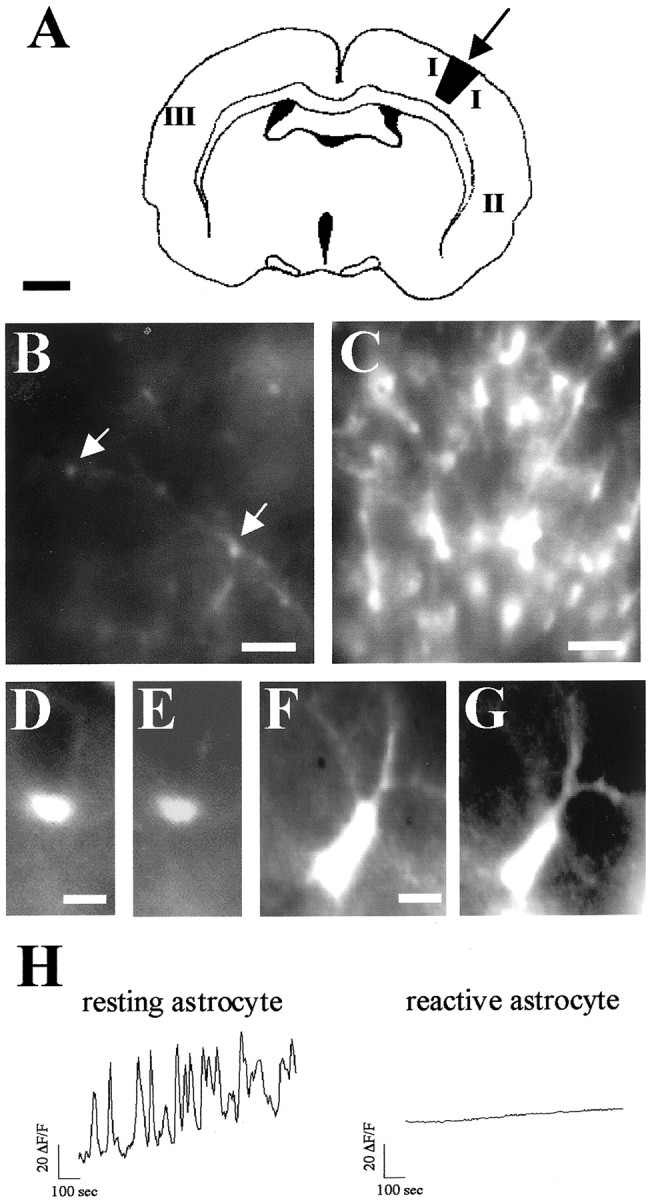
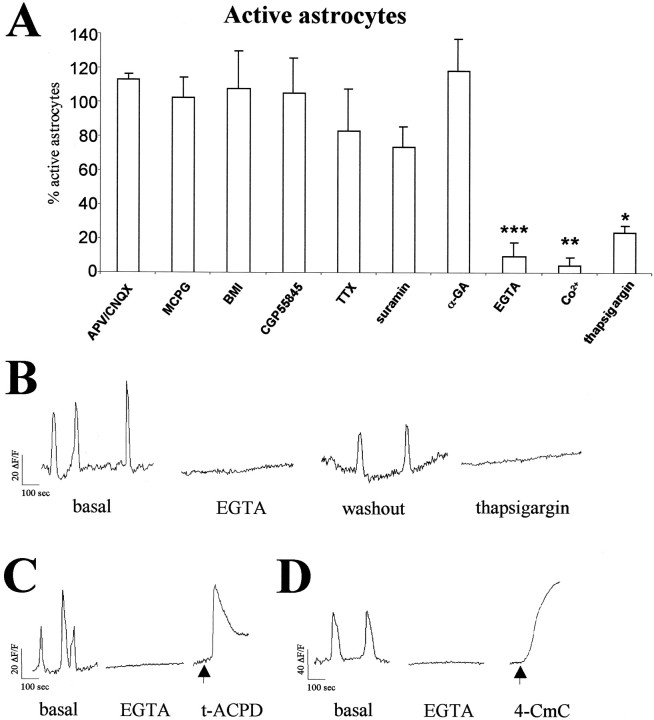
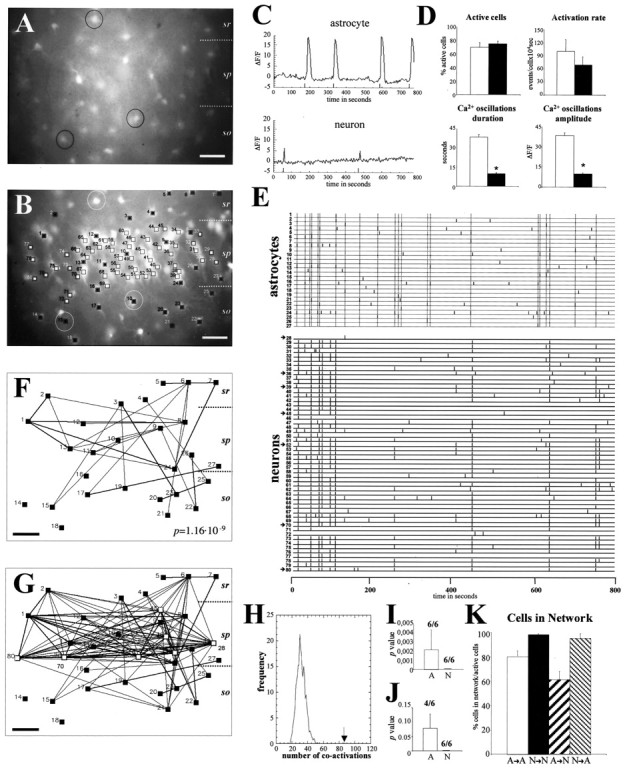
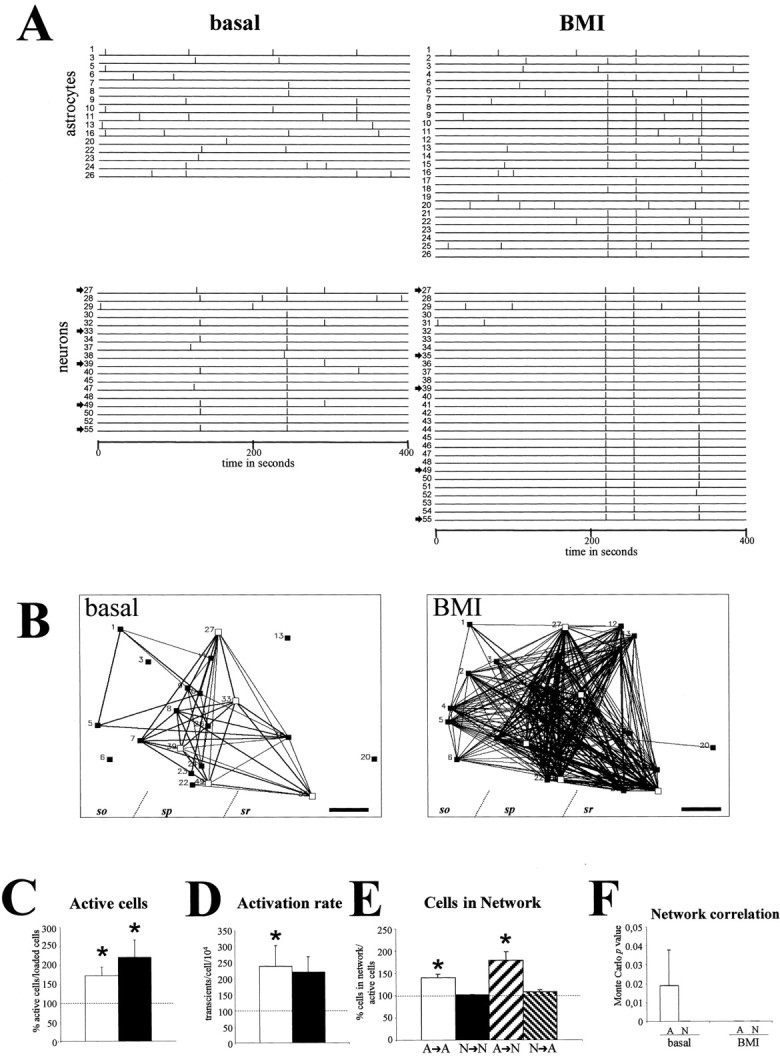
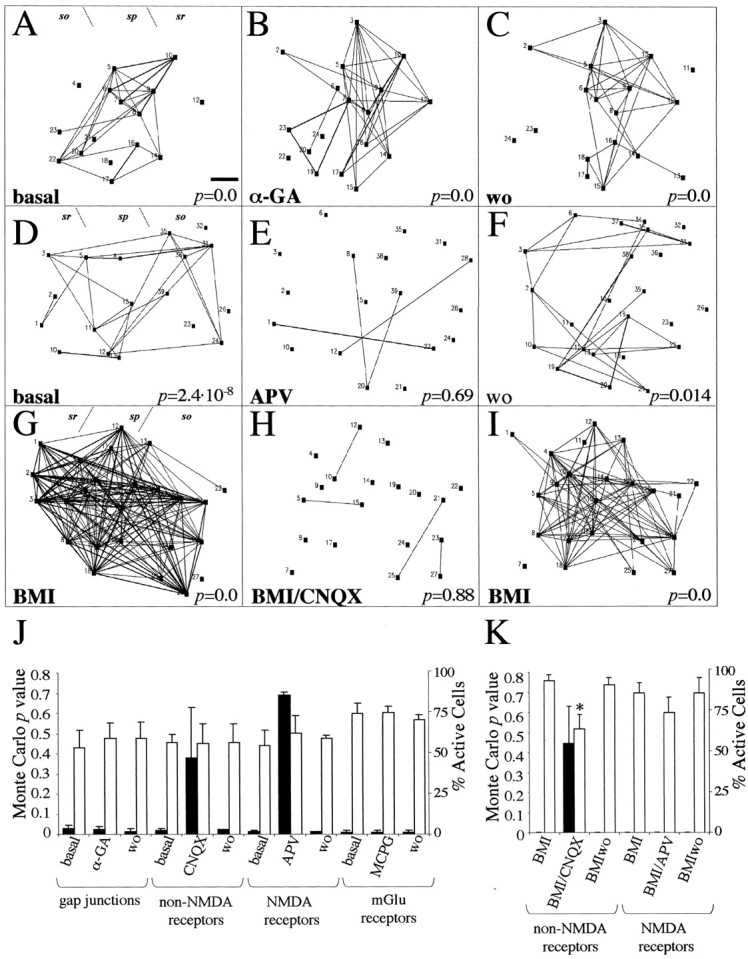
Spontaneous neuronal activity is essential to neural development. Until recently, neurons were believed to be the only excitable cells to display spontaneous activity. However, cultured astrocytes and, more recently, astrocytes in situ are now known to exhibit spontaneous Ca2+ transients. Here we used Ca2+ imaging of astrocytes from transgenic mice for the simultaneous monitoring of [Ca2+]i changes in large numbers of astrocytes. We found that spontaneous activity is a common property of most brain astrocytes that is lost in response to a lesion. These spontaneous [Ca2+]i oscillations require extracellular and intracellular Ca2+. Moreover, network analysis revealed that most astrocytes formed correlated networks of dozens of these cells, which were synchronous with both astrocytes and neurons. We found that decreasing spontaneous [Ca2+]i transients in neurons by TTX does not alter the number of active astrocytes, although it impairs their synchronous network activity. Conversely, bicuculline-induced epileptic patterns of [Ca2+]i transients in neurons cause an increase in the number of active astrocytes and in their network synchrony. Furthermore, activation of non-NMDA and NMDA ionotropic glutamate receptors is required to correlate astrocytic networks. These results show that spontaneous activity in astrocytes and neurons is patterned into correlated neuronal/astrocytic networks in which neuronal activity regulates the network properties of astrocytes. This network activity may be essential for neural development and synaptic plasticity.


Figures

Fig. 1.
Fig. 1.
Spontaneous [Ca2+]i oscillations are a common feature of astrocytes in situ. A,B, Paired fluorescence photomicrographs showing the same field under fura-2 (A) and GFP (B) fluorescence, illustrating GFP/fura-2-labeled astrocytes in layers II–III of the neocortex of P7 GFAP/GFP mice. Double-labeled astrocytes are indicated by arrows; pyramidal neurons lacking GFP fluorescence are indicated byarrowheads. C, Fluorescence photomicrograph illustrating fura-2-loaded Bergmann glial cells (arrows) in a P25 cerebellar slice. Purkinje cells, devoid of fura-2 loading, are labeled by asterisks.D, Representative spontaneous changes of fura-2 fluorescent signal (ΔF/F) over time recorded in astrocyte somata located in distinct CNS regions of P6–P25 GFAP/GFP mice. The spontaneous activity profile of the neocortical astrocyte corresponds to the astrocyte shown inA and B. Note bursting and oscillatory Ca2+ changes in the examples shown in the thalamus and hippocampus, respectively. Scale bars: A,B, 20 μm; C, 12 μm.Mol, Molecular layer; P, Purkinje cell layer; GL, granule cell layer.
Fig. 2.
Fig. 2.
Reactive astrocytes lack spontaneous [Ca2+]i transients. A, Schematic diagram illustrating the location of the stab wound lesion in the parietal cortex (arrow) of P24 GFAP/GFP neocortex and the areas in which spontaneous astrocytic activity was recorded 48 hr after the lesion (I, II, andIII). B, C, Low-magnification photomicrographs showing GFAP/GFP-positive astrocytes (arrows) in areas III (B, resting astrocytes) and I (C, reactive astrocytes). Note that the number of astrocytes and the intensity of GFP fluorescence are markedly increased in astrocytes around the lesion.D–G, Higher-magnification photomicrographs of typical GFAP/GFP-positive resting astrocytes in area III (D, E) and reactive GFAP/GFP-positive astrocytes in area I (F, G). Intense GFP positive-reactive astrocytes have larger somata and hypertrophied processes (F) than resting GFP cells (D). In both resting (E) and reactive (G) astrocytes, the fura-2 indicator was loaded similarly.H, [Ca2+]i profiles over 800 sec of representative GFAP/GFP-positive astrocytes recorded near the lesion site (reactive astrocyte; area I) and in the contralateral hemisphere (resting astrocyte; area III). Scale bars: A, 1 mm; B,C, 40 μm; DG, 5 μm.
Fig. 3.
Fig. 3.
Pharmacological analysis of spontaneous [Ca2+]i transients in hippocampal astrocytes. A, Histograms illustrating the percentage of hippocampal P2–P6 GFAP/GFP-positive astrocytes showing spontaneous Ca2+ activity after administration of a range of neurotransmitter receptor antagonists, TTX, and blockers of Ca2+ mobilization. Significant reductions are observed after EGTA, Co2+, and thapsigargin treatments (*p < 0.05; **p < 0.01; ***p < 0.001). Each experimental condition was performed in at least three slices. Data are expressed as percentages of control values (mean ± SEM). B, Representative plots of [Ca2+]ioscillations recorded in the same GFAP/GFP-positive astrocyte from a P6 mouse perfused with normal ACSF (basal and washout), Ca2+-free ACSF (2 mm EGTA, 0 mm [Ca2+]o), and thapsigargin (2 μm). C, D, [Ca2+]i oscillations recorded in P5 GFAP/GFP-positive astrocytes are abolished after perfusion of Ca2+-free ACSF. Addition of t-ACPD and 4-CmC (arrows) to nominally Ca2+-free ACSF caused a transient and a progressive increase in [Ca2+]i, respectively. Abbreviations are defined in Materials and Methods.
Fig. 4.
Fig. 4.
Spontaneous [Ca2+]i oscillations in hippocampal astrocytes belong to correlated neuronal/astrocytic networks.A, B, Paired fluorescence photomicrographs illustrating many GFAP/GFP-positive astrocytes (A) in the CA1 region of the hippocampus (P6) that are also labeled with fura-2 (e.g., cells in circles) (B). Fura-2-loaded cells showing spontaneous fluorescence changes over time are labeled by squares. Blacksquaresmark GFP-positive astrocytes, whereas GFP-negative neurons (located mainly in the pyramidal layer) are labeled by white squares. C, Representative plots of spontaneous changes of fura-2 fluorescence (ΔF/F) over 800 sec in astrocytes and neurons in the CA1 hippocampal region. The initiation of each [Ca2+]i oscillation is labeled by a thick mark at the bottom of the plot. D, Histograms illustrating properties of spontaneous [Ca2+]i oscillations in astrocytes (white bars) and neurons (black bars). Both the duration and amplitude of spontaneous Ca2+ activations are higher in astrocytes than in neurons, whereas the proportion of active cells and the rate of oscillations are similar in both populations. E, Raster plot representing the activation profile of each of the 80 active cells shown in B over 800 sec. In the raster plot, each active cell is represented by a line, and each thick line marks the initiation of a [Ca2+]i transient. Cells127 correspond to astrocytes, and2880 correspond to neurons.Dotted lines in the astrocyte raster plot indicate simultaneous coactivation of at least two cells of the plot. Synchronous coactivation among large numbers of neurons can also be seen clearly. F, Correlation map illustrating each active astrocyte of B (black squares), in which cells with statistically significant correlation coefficients are connected by lines. The thickness of thelines is proportional to the degree of significance. Most active astrocytes appear to belong to a correlated network.G, Correlated map representing synchronous correlations among all the astrocytes (black squares) shown inF and seven representative neurons (white squares, arrows in raster plot). Observe how many astrocytes are synchronously connected with neuronal cells.H, Distribution of pairwise correlations found in the real data (arrow) and in 1000 simulations obtained by the Monte Carlo test (bell-shaped curve) of the astrocyte population shown in B. Note how the number of correlated events in the real data set (arrow) exceeds those expected by chance in simulated data. The correspondingp value is shown in F. I, Average of Monte Carlo p values showing the probability that the number of times that any two cells had simultaneous onset of activation was caused by chance. Although all cases in both astrocytes (6 of 6; A) and neurons (6 of 6;N) are significant (p< 0.05), astrocytic values are higher than neuronal ones.J, Average of Monte Carlo p values showing the probability that the number of times the same cells were activated simultaneously at least twice was caused by chance. Each set of neuronal populations gives a 0 p value (6 of 6;N), whereas in astrocytic cells only four of six cases are significant (p < 0.05) (A). Both I and Jillustrate the higher synchronous correlation level of spontaneous [Ca2+]i oscillations among neurons than among astrocytes. K, Histograms summarizing the proportion of spontaneous active cells with statistically significant correlation coefficients: among astrocytes (AA), among neurons (NN), percentage of astrocytes coactive with neurons (AN), and percentage of neurons coactive with astrocytes (NA). Statistical significance: *p < 0.0001. Scale bar, 40 μm.sr, Stratum radiatum; sp, stratum pyramidale; so, stratum oriens.
Fig. 5.
Fig. 5.
Spontaneous astrocytic correlated network activity is impaired after TTX treatment. A, Raster plot illustrating the activation profiles of astrocytes (cells116) and neurons (cells1752) of a hippocampal CA1 field from a P6 GFAP/GFP mouse before (basal) and after TTX administration. Although major changes are not observed in the astrocyte population, neuron activity is greatly impaired.B, Correlation maps of all active astrocytes (black squares) and a representative fraction of active neurons (white squares, arrows in raster plots) illustrated in A. After TTX treatment active neurons and their correlations are almost absent, whereas correlated astroglial activity persisted. C, Spontaneous active astrocytes (white bar) and neurons (black bar) in relation to basal conditions after TTX administration.D, Activity rate in astrocytes (white bar) and neurons (black bar) in relation to control after TTX administration. E, Histograms summarizing the proportion of spontaneous active cells with statistically significant correlation coefficients after TTX: among astrocytes (AA), among neurons (NN), percentage of astrocytes coactive with neurons (AN), and percentage of neurons coactive with astrocytes (NA). F, Average of Monte Carlo p values showing the probability that the number of times that any two cells had simultaneous onset of activation was caused by chance. Both astrocytes (A) and neurons (N) exhibit very significant values in basal conditions, whereas TTX treatment decorrelates spontaneous activity in both neural populations. Significant reductions (*p < 0.05) are observed after TTX. Scale bar, 40 μm. sr, Stratum radiatum; sp, stratum pyramidale; so, stratum oriens.
Fig. 6.
Fig. 6.
Spontaneous astrocytic correlated network activity increases in BMI-induced epileptiform status. A, Raster plot illustrating the activation profiles of astrocytes (cells126) and neurons (cells2755) of a hippocampal CA1 field from a P9 GFAP/GFP mouse before (basal) and after BMI administration. BMI enhances spontaneous activity in both astrocytic and neuronal populations. B, Correlation maps showing all active astrocytes (black squares) and a representative fraction of active neurons (white squares, arrowsin raster plots) shown in A. After BMI treatment, correlated activity increased among astroglial and neuronal cells.C, Percentage of spontaneous active astrocytes (white bar) and neurons (black bar) in relation to basal conditions after BMI administration.D, Percentage of activity rate in astrocytes (white bar) and neurons (black bar) in relation to control after BMI administration. E, Proportion of active astrocytes and neurons showing statistically significant synchrony calculated from correlation maps after BMI administration with respect to basal conditions. After BMI incubation, astrocytes increase their synchronous correlation with both astrocytes and neurons. F, Average of Monte Carlo pvalues showing the probability that the number of times that any two cells had simultaneous onset of activation was caused by chance. Both astrocytes (A) and neurons (N) exhibit very significant values in basal conditions, whereas BMI treatment decreases p values in astroglial populations. Statistical significance: *p < 0.05. Scale bar, 40 μm. sr, Stratum radiatum; sp, stratum pyramidale;so, stratum oriens.
Fig. 7.
Fig. 7.
Mechanisms that control network correlation of spontaneous astrocytic activity in the hippocampus.A–C, Correlation maps showing coordinated activity of a P6 astrocyte network at basal conditions (A), after incubation with the gap junction blocker α-GA (B), and after washout (wo) with α-GA (C). Note that the network correlation, indicated by Monte Carlo p value (bottomof the map), is not perturbed by blocking gap junctions.D–F, Correlation maps showing the effect of NMDA receptor blockade on a P5 astrocyte network. Correlated Ca2+ events in nontreated astrocytes (D) are reduced by APV incubation (E) and recovered after washing the antagonist (F). G–I, Network astrocyte correlation in a BMI-treated hippocampal slice (G) is markedly decreased by addition of CNQX (H) and restored by washing the non-NMDA antagonist (I). J, Histogram showing the average of Monte Carlo p values (black bars, left) and the percentage of active astrocytes (white bars, right) after addition of gap junction blockers and glutamate receptor antagonists in basal GFAP/GFP hippocampal slices. K, Average of astrocyte network correlations (black bars,left) and percentage of active astrocytes (white bars, right) after administration of ionotropic glutamate receptor antagonists in BMI-treated hippocampal slices. Each experimental condition was performed in at least three different slices. Statistical significance: *p < 0.05. Scale bar, 45 μm. sr, Stratum radiatum; sp, stratum pyramidale; so, stratum oriens.

Similar articles

Cited by

References

    1. Aguiló A, Schwartz TH, Kumar VS, Peterlin ZA, Tsiola A, Soriano E, Yuste R. Involvement of Cajal-Retzius neurons in spontaneous correlated activity of embryonic and postnatal layer 1 from wild-type and reeler mice. J Neurosci. 1999;19:10856–10868. - PMC - PubMed
    1. Albowitz B, König P, Kuhnt U. Spatiotemporal distribution of intracellular calcium transients during epileptiform activity in guinea pig hippocampal slices. J Neurophysiol. 1997;77:491–501. - PubMed
    1. Alvarez-Maubecin V, García-Hernández F, Williams JT, van Bockstaele EJ. Functional coupling between neurons and glia. J Neurosci. 2000;20:4091–4098. - PMC - PubMed
    1. Araque A, Parpura V, Sanzgiri RP, Haydon PG. Glutamate-dependent astrocyte modulation of synaptic transmission between cultured hippocampal neurons. Eur J Neurosci. 1998a;10:2129–2142. - PubMed
    1. Araque A, Sanzgiri RP, Parpura V, Haydon PG. Calcium elevations in astrocytes cause an NMDA receptor-dependent increase in the frequency of miniature synaptic currents in cultured hippocampal neurons. J Neurosci. 1998b;18:6822–6829. - PMC - PubMed

Publication types

MeSH terms

LinkOut - more resources