. 2002 Nov 1;22(21):9475-89.
doi: 10.1523/JNEUROSCI.22-21-09475.2002.

Response of neurons in the lateral intraparietal area during a combined visual discrimination reaction time task

Affiliations

Response of neurons in the lateral intraparietal area during a combined visual discrimination reaction time task

Jamie D Roitman et al. J Neurosci. .

Abstract

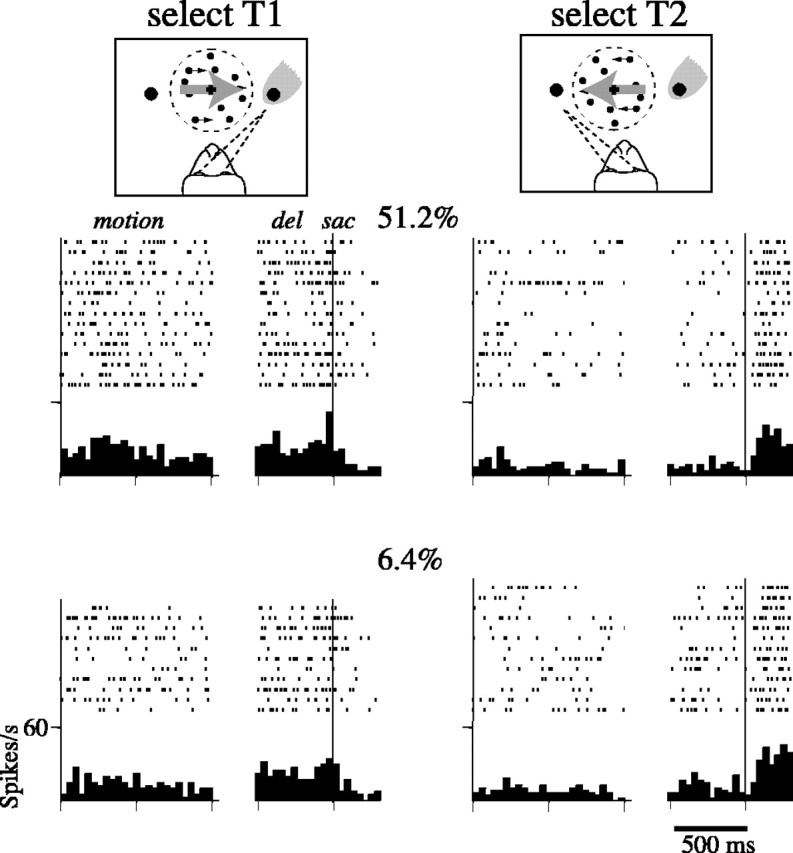
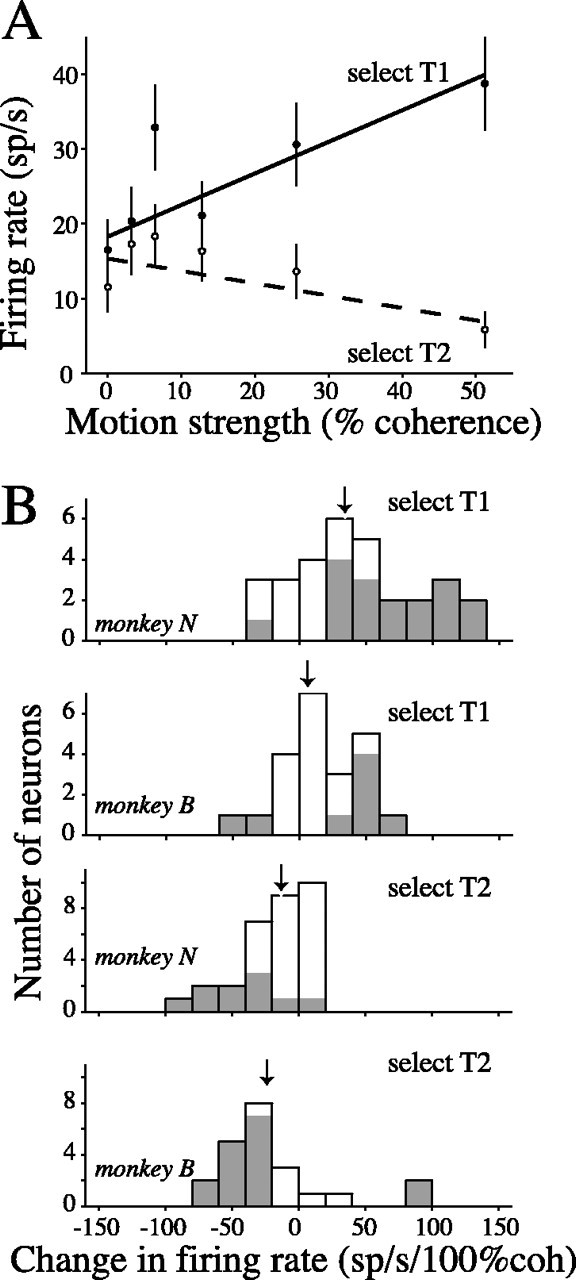
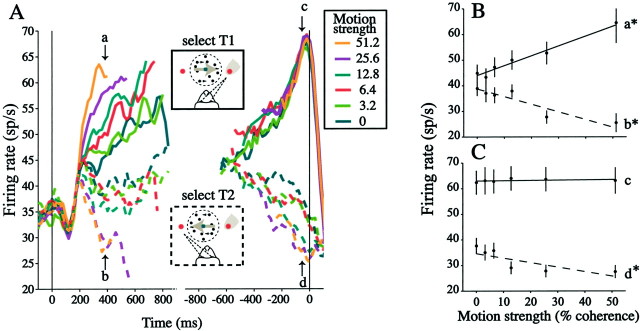
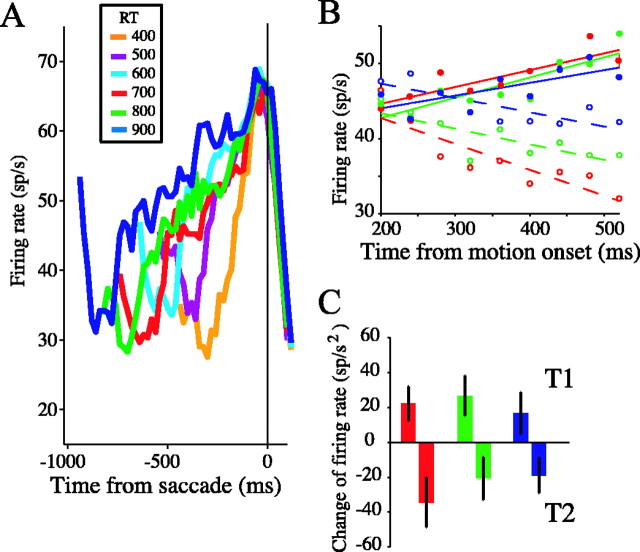
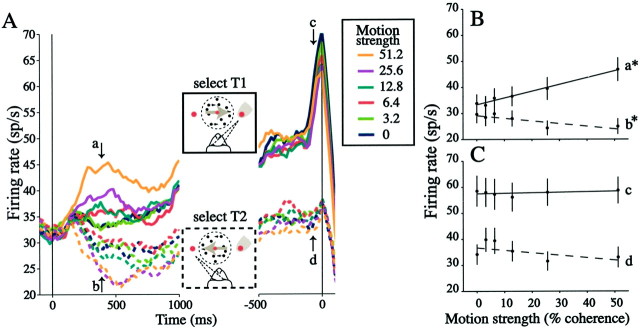
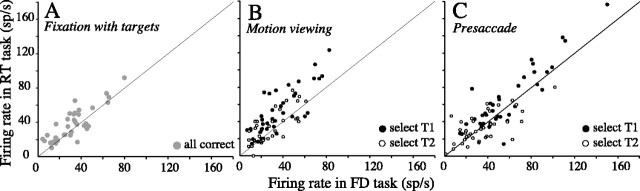
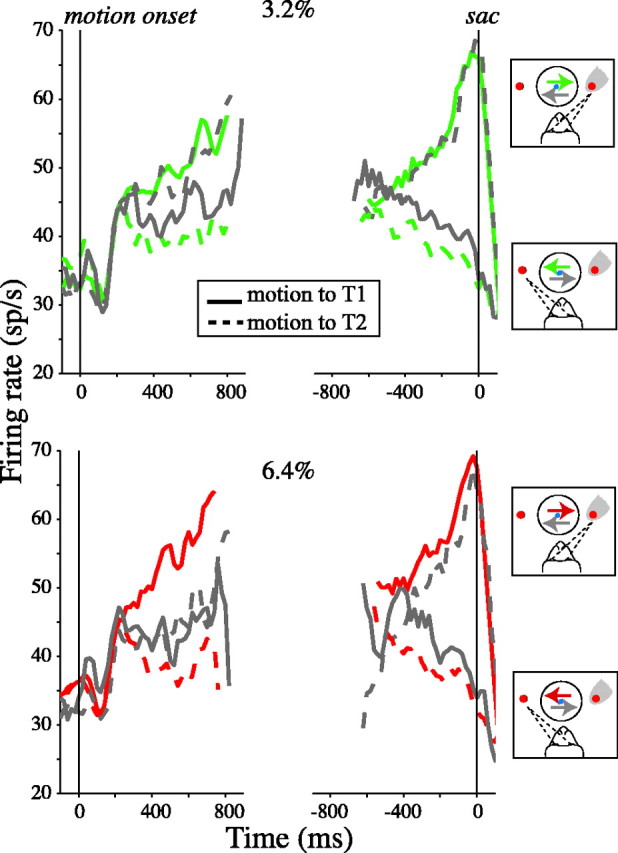
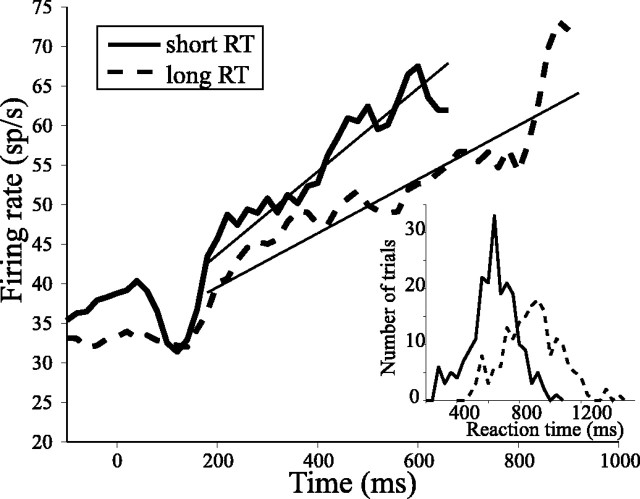
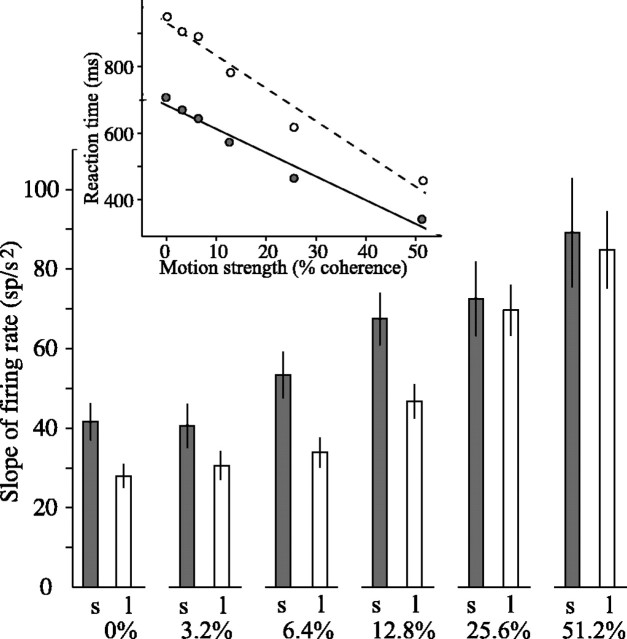
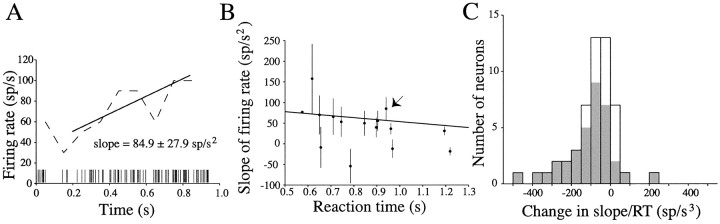
Decisions about the visual world can take time to form, especially when information is unreliable. We studied the neural correlate of gradual decision formation by recording activity from the lateral intraparietal cortex (area LIP) of rhesus monkeys during a combined motion-discrimination reaction-time task. Monkeys reported the direction of random-dot motion by making an eye movement to one of two peripheral choice targets, one of which was within the response field of the neuron. We varied the difficulty of the task and measured both the accuracy of direction discrimination and the time required to reach a decision. Both the accuracy and speed of decisions increased as a function of motion strength. During the period of decision formation, the epoch between onset of visual motion and the initiation of the eye movement response, LIP neurons underwent ramp-like changes in their discharge rate that predicted the monkey's decision. A steeper rise in spike rate was associated with stronger stimulus motion and shorter reaction times. The observations suggest that neurons in LIP integrate time-varying signals that originate in the extrastriate visual cortex, accumulating evidence for or against a specific behavioral response. A threshold level of LIP activity appears to mark the completion of the decision process and to govern the tradeoff between accuracy and speed of perception.


Figures

Fig. 1.
Fig. 1.
Representative MRI of recording sites from one monkey. The coronal images show the area of the intraparietal sulcus (ips) studied in these experiments. The recording grid can be seen above the ips. The arrowheads next to the ips represent the boundaries of the locations from which neurons were recorded. Images were obtained using STIR acquisition in 1.5T using carotid RF coils adjacent to the head. Slices are centered 1.5 mm apart (3 mm thickness). The diagram is a lateral view of the brain showing the location of the corresponding coronal images.
Fig. 2.
Fig. 2.
Direction discrimination tasks. Monkeys discriminated the direction of motion in a dynamic random-dot display. The color of the fixation point signified whether the experiment follows a reaction time or fixed duration protocol, which were conducted in separate blocks. A, Reaction time version. After fixation, two choice targets appeared in the periphery. One of the targets was within the response field (RF) of the neuron, indicated by the gray shading. After a variable delay period, dynamic random dots appeared in a 5° diameter aperture. The fraction of coherently moving dots and the direction of motion, toward one of the choice targets, were selected at random from a predetermined list of values. The monkey was allowed to make a saccadic eye movement to a choice target at any time after onset of random-dot motion to indicate the direction of perceived motion. A liquid reward was administered for choosing the correct target in the direction of motion and on half the trials in which there was no coherent motion. See Materials and Methods for additional details. Reaction time (RT) is defined as the interval from motion onset to saccade initiation. B, Fixed duration version. After the monkey fixated the central point, two choice targets appeared for 700 msec. The monkey maintained fixation through a 1 sec motion-viewing period followed by a variable duration memory delay. When the fixation point was extinguished, the monkey reported its judgment by making an eye movement to a choice target.
Fig. 3.
Fig. 3.
Behavioral data from one experiment. A, Psychometric functions from RT and FD versions of the direction discrimination task. RT and FD tasks were performed in alternating blocks of ∼60 trials. The probability of a correct direction judgment is plotted as a function of motion strength and fit by sigmoid functions (see Materials and Methods, Eq. 1). Vertical linesindicate psychophysical thresholds (α in Eq. 1): the motion strength that would support 82% correct choices (horizontal dashed line). B, Effect of motion strength on reaction time. Mean RT (± SEM) was obtained from correct trials in the experiment inA (RT block). The line is a least squares regression of RT versus log motion coherence (p< 0.001).
Fig. 4.
Fig. 4.
Response of an LIP neuron during the RT-direction-discrimination task. Data were obtained from the block of RT trials depicted in Figure 3. Only correct choices at two motion strengths are shown. The diagram at the top indicates whether the monkey's behavioral response was an eye movement into or out of the response field (gray shading). Spike rasters and response histograms are aligned to the beginning of the monkey's eye movement response (sac). Caretsdenote the onset of random-dot motion. Trial rasters are sorted by RT. The monkey took longer to decide the direction of the weaker (6.4% coherent) motion. Notice the buildup and attenuation of activity that occurred during motion viewing (spike histogram binwidth = 20 msec). Spikes/s, Spikes per second.
Fig. 5.
Fig. 5.
Response of an LIP neuron during the FD-direction-discrimination task. Data were obtained from the block of FD trials depicted in Figure 3 (same neuron as Fig. 4). The diagram at the top indicates whether the monkey's behavioral response was an eye movement into or out of the response field (gray shading). Spike rasters and histograms are aligned to two events in each trial. In the left portion of each axis, the responses are aligned to the onset of motion, which is then followed by a 1 sec motion-viewing period. In theright portion of the axes, the delay period (del) response is shown aligned to saccade initiation (sac). The break in the panel is attributable to the variable length of the delay period. The elevated spike rate accompanying T1 choices was more pronounced for the easier (51.2% coherent) motion (spike histogram binwidth = 20 msec).
Fig. 6.
Fig. 6.
Effect of motion strength on LIP response during decision formation. Graphs depict the effect of stimulus strength on single neuron activity for trials ending in the same eye movement. All data are from correct choices in the RT version of the discrimination task. A, Effect of motion strength on firing rate for the neuron shown in Figures 3 and 4. Spike rate (mean ± SEM) was measured in the same 100 msec epoch for each motion strength. The epoch was chosen to end at the median RT for trials using the strongest (easiest) motion strength. Lines are weighted least squares fits (Eq. 2A) performed separately for T1 and T2 choices (T1,filled symbols, solid line; T2, open symbols, dashed line). The activity of this neuron increased 42.2 spikes per second per 100% coherence for T1 choices (CI: 14.6–69.9) and decreased 16.5 spikes per second per 100% coherence for T2 choices (CI: −29.0 to −4.0). B, Effect of motion strength on firing rate for each of the neurons in our data set. For each neuron, the change in firing rate per 100% coherence was estimated by the slope of the best fitting line as in A.Results are shown separately for T1 and T2 choices and for each monkey.Shading indicates p < 0.05 (Eq. 2A, H0: β2 = 0 ). Means are shown by arrows (from top to bottom, 30.9 ± 8.6, 22.2 ± 7.3, −12.5 ± 4.6, −22.9 ± 6.2; differences between monkeys were not significant;p = 0.46 and 0.17 for T1 and T2 comparisons, respectively; t test). sp/s, Spikes per second;coh, coherence.
Fig. 7.
Fig. 7.
Time course of LIP activity in the RT-direction-discrimination task. A, Average response from 54 LIP neurons. Responses are grouped by motion strength and choice as indicated by color and line type. The responses are aligned to two events in the trial. On the left, responses are aligned to the onset of stimulus motion. Response averages in this portion of the graph are drawn to the median RT for each motion strength and exclude any activity within 100 msec of eye movement initiation. On the right, responses are aligned to initiation of the eye movement response. Response averages in this portion of the graph show the buildup and decline in activity at the end of the decision process. They exclude any activity within 200 msec of motion onset. The average firing rate was smoothed using a 60 msec running mean. Arrows indicate the epochs used to compare spike rate as a function of motion strength in the next panels.Arrows a and b mark the 40 msec epoch ending at the median RT for 51.2% motion trials (370–410 msec after stimulus onset); arrows c and d mark the 40 msec epoch ending 30 msec before saccade initiation. Only correct choices are included in these graphs for motion coherences >0%. B, Effect of motion strength on firing rate during decision formation. Response averages were obtained from 54 neurons in the 40 msec epochs corresponding to arrows a and b above. When motion was toward the RF (solid line; epoch a), the spike rate increased linearly as a function of motion strength. When motion was away from the RF (dashed line; epochb), the spike rate decreased as a function of motion strength. Note that, for the 0% coherence stimulus, there was no net direction of motion, but the activity was greater when the monkey chose the T1 direction. Symbols represent weighted means ± SEM. Lines are weighted least squares fits to Equation 2A(*p < 0.05; H0: β2 = 0 ). C, Effect of motion strength on firing rate at the end of the decision process. Response averages were obtained from 54 neurons in the 40 msec epochs corresponding to arrows c and d. The large response preceding eye movements to the RF (solid line,filled circles; arrow c) did not depend on the strength of motion. Responses preceding eye movements away from the RF were more attenuated with stronger motion stimuli (dashed line; arrow d). Use of weighted means in Band C introduces small discrepancies from averages indicated by arrows in A.
Fig. 8.
Fig. 8.
Time course of activity on trials with similar reaction time. A, Population average responses for T1-choice trials. The responses are aligned to saccade initiation.Color designates the RT of the trials included in the average, which fall within 25 msec of the time indicated (e.g., 400–425 msec). All spikes are included in these averages (n = 54 neurons). Average firing rate was smoothed using a 60 msec running mean. B, The gradual change in spike rate is evident hundreds of milliseconds before the monkey discriminates motion. Trials with long RT were selected for a closer examination of an early portion of motion viewing period, from 200 to 500 msec after motion onset. This epoch corresponds to the beginning of the coherence-dependent response after the stereotyped dip after motion onset and ends at least 200 msec before the saccadic response. Trials are grouped by RT spanning a 100 msec range: 700–799, 800–899, and 900–999 msec, indicated by red, green, andblue, respectively. Points show the average firing rate, calculated in non-overlapping 40 msec bins. A representative error bar (± 1 SEM) is shown for one data point. Lines are weighted least squares fits (Eq. 3B) performed separately for each RT group. Solid lines andfilled symbols correspond to T1 choices; dashed lines and open symbols correspond to T2 choices. The slope (β2) estimates the change in firing rate as a function of time. C, Response change as a function of time during early motion viewing. Bars represent the slope from the fits in B (error bars represent 95% confidence intervals). The ability to detect linear trends in this epoch implies that the ramp-like responses in Figure 7 do not arise as a consequence of averaging responses that step from an intermediate level of firing to a high or low rate once the decision is formed.
Fig. 9.
Fig. 9.
Time course of LIP activity in the FD-direction-discrimination task. A, Average response from 38 LIP neurons. Responses are grouped by motion strength and choice as indicated by color and line type. On theleft, responses are aligned to the onset of stimulus motion. On the right, responses are aligned to initiation of the saccadic response. Response averages in this portion of the graph show activity during the delay period. Otherwise, we use the same labeling conventions as in Figure 7A. Arrows indicate the epochs used to compare spike rate as a function of motion strength in the next panels. Arrows a and b mark the 40 msec epoch from 370 to 410 msec after stimulus onset, corresponding to time points from Figure 7; arrows c and d mark the epoch ending 30 msec before saccade initiation. B, Effect of motion strength on firing rate during motion viewing. Same conventions as in Figure 7B. C, Effect of motion strength on firing rate at the end of the delay period and shortly before the eye movement response. Same conventions as Figure 7C. Motion strength did not affect the level of spike discharge late in the delay period.
Fig. 10.
Fig. 10.
Comparison of neural activity on RT and FD tasks. Scatter plots depict average spike rates from three comparable epochs for 38 neurons studied in both tasks. A, Response before onset of motion. Response averages are from the 40 msec epoch before onset of random-dot motion, when choice targets and fixation point are visible. All correct choices are included in the response averages. B, Response during motion viewing. Response averages are from the 100 msec epoch ending at the median RT for the easiest motion strength (310–410 msec). Averages are computed separately for T1 and T2 choices, as indicated. Only correct choices accompanying 12.8% coherent motion are shown. C, Response preceding eye movements. Response averages are from the period 30–70 msec before the eye movement response. Averages are computed separately for T1 and T2 choices, as indicated. All correct choices are included.
Fig. 11.
Fig. 11.
Comparison of errors with correct discriminations on the RT task. The average responses from 54 LIP neurons are shown for two weak motion strengths. Axes use the same conventions as in Figure 7A. The diagrams shown to the rightindicate the direction of motion and the monkey's choice. Thecolored curves show correct trials; the direction of motion is toward the chosen target. These curves are replicas of those shown in Figure 7A. Gray curves represent error trials; the direction of motion is away from the chosen target.
Fig. 12.
Fig. 12.
Relationship between LIP response and reaction time at a fixed motion strength. Average spike rate from 54 experiments is plotted as a function of time from onset of motion using all correct T1 choices at a near-threshold motion strength (6.4% coherence toward the RF). Trials from each experiment were divided into short and long RT with respect to the median. The inset shows the distribution of reaction times contributing to each group. There is considerable overlap because the median RT varied across experiments. Average spike rate functions were computed in 20 msec time bins aligned to motion onset (t = 0) excluding activity within 100 msec of saccade initiation. Lines are weighted least squares fits to Equation 3C in the epoch from t > 200 msec. The slopes (and confidence intervals) of these fits are plotted in Figure 13.
Fig. 13.
Fig. 13.
Relationship between LIP response and reaction time at each of the six motion strengths. Histograms show the rate of increase in spike rate during motion viewing (T1 choices only). For each coherence level, trials were sorted into a short or long RT group as in Figure 12. Spike rate versus time functions for each group were fit with Equation 3C in epochs beginning 200 msec after motion onset and ending at the median RT. The analysis was performed separately for each motion strength (percentage of coherence). Only correct choices were analyzed for nonzero coherence motion. Error bars represent 95% confidence intervals. Inset, The median reaction time for correct choices at each of the motion coherence values (solid curve and filled circles, short RT; dashed curve and open circles, long RT).
Fig. 14.
Fig. 14.
Trial-by-trial correlation between LIP response and reaction time. A, Example of a trial spike train and estimated rate function from one trial. The raster shows the times of action potentials with respect to the time of motion onset (t = 0). The dashed line indicates average firing rate calculated in 100 msec bins. For this analysis, spike rate is assumed to follow linear function of time. The fit maximizes the likelihood of observing the sequence of spikes in the epoch from 200 msec after motion onset to 100 msec before saccade initiation (Eq. 5, see Materials and Methods). It provides an estimate of the slope of the “firing-rate-versus-time” function and its standard error.B, Relationship between reaction time and slope of the firing-rate-versus-time function for one neuron. Each pointrepresents the estimated slope from a single trial. Error bars are ± 1 SE. Only data from correct T1 choices at 6.4% coherent motion are shown. The slope of this line is −48.3 spikes per second cubed (i.e., change in slope of the firing-rate-versus-time line per 1 sec change in RT). The weighted average slope across all motion strengths was −14.8 ± 10.5 spikes per second cubed for this neuron (Eq. 6).C, Summary of the trial-by-trial relationship between spike rate and RT across the population of 54 neurons. For each neuron, the relationship between RT and slope of the firing-rate-versus-time function was estimated using the strategy developed in A andB. The histogram shows the change in slope of the firing-rate-versus-time function per second of RT for each unit.Shaded bars represent neurons with a significant trial-by-trial relationship between slope and RT (p < 0.05) (Eq. 6, H0: β3 = 0 ).

Similar articles

Cited by

References

    1. Barash S, Bracewell RM, Fogassi L, Gnadt JW, Andersen RA. Saccade-related activity in the lateral intraparietal area. I. Temporal properties; comparison with area 7a. J Neurophysiol. 1991a;66:1095–1108. - PubMed
    1. Barash S, Bracewell RM, Fogassi L, Gnadt JW, Andersen RA. Saccade-related activity in the lateral intraparietal area. II. Spatial properties. J Neurophysiol. 1991b;66:1109–1124. - PubMed
    1. Bracewell RM, Mazzoni P, Barash S, Andersen RA. Motor intention activity in the macaque's lateral intraparietal area. II. Changes of motor plan. J Neurophysiol. 1996;76:1457–1464. - PubMed
    1. Britten KH, Shadlen MN, Newsome WT, Movshon JA. The analysis of visual motion: a comparison of neuronal and psychophysical performance. J Neurosci. 1992;12:4745–4765. - PMC - PubMed
    1. Britten KH, Shadlen MN, Newsome WT, Movshon JA. Responses of neurons in macaque MT to stochastic motion signals. Vis Neurosci. 1993;10:1157–1169. - PubMed

Publication types

MeSH terms