. 2002 Nov 1;22(21):9618-25.
doi: 10.1523/JNEUROSCI.22-21-09618.2002.

Perception of brightness and brightness illusions in the macaque monkey

Affiliations

Perception of brightness and brightness illusions in the macaque monkey

Xin Huang et al. J Neurosci. .

Abstract

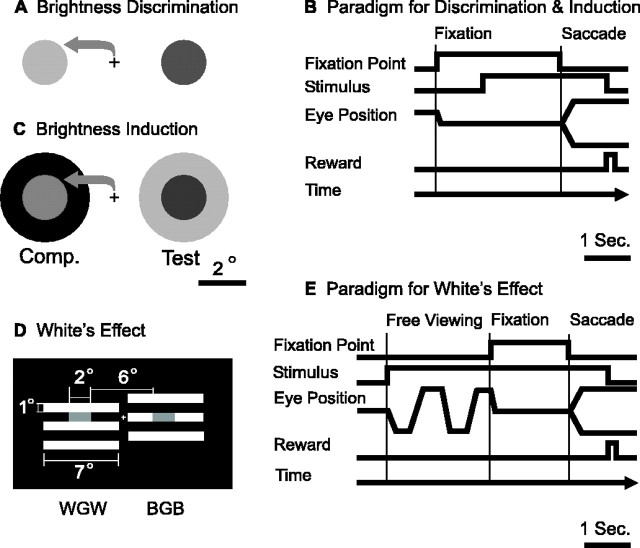
Recent physiological studies show that neural responses correlated with the perception of brightness are found in cortical area V1 but not earlier in the visual pathway (Kayama et al., 1979; Reid and Shapley, 1989; Squatrito et al., 1990; Komatsu et al., 1996; Rossi et al., 1996; MacEvoy et al., 1998; Rossi and Paradiso, 1999; Hung et al., 2001; Kinoshita and Komatsu, 2001; MacEvoy and Paradiso, 2001). However, these studies are based on comparisons of neural responses in animals with brightness perception in humans. Very little is known about the perception of brightness in animals typically used in physiological experiments. In this study, we quantify brightness discrimination, brightness induction, and White's effect in macaque monkeys. The results show that, qualitatively and quantitatively, the perception of brightness in macaques and humans is quite similar. This similarity may be an indication of common underlying neural computations in the two species.


Figures

Fig. 1.
Fig. 1.
Experimental design. A, In brightness discrimination, an animal fixated a central point and then saccaded to the brighter of two 1° radius disks centered at 3° eccentricity to each side of fixation. B, In both discrimination and induction experiments, animals fixated for 1 sec, two stimuli were presented, and, after a variable delay of 1.2–1.8 sec, the fixation point was extinguished, cueing the animal to saccade to the brighter target. C, The brightness induction task was identical to brightness discrimination, except that the two disks were surrounded by 1° thick annuli. The test disk had a luminance of either 12.6 or 32.2 cd/m2, and the test surround was given six to seven different luminances. The comparison disk took on a range of luminances, and the comparison surround was fixed at 1.3 cd/m2. D, To study White's effect, two square-wave luminance gratings were placed side-by-side. The black and white stripes had luminances of 0.2 and 81 cd/m2, respectively. A 1° × 2° gray patch was superimposed on a black stripe on one of the gratings and a white stripe on the other. The patch on the black stripe (white–gray–white or WGW stimulus) had a luminance of 14.1 or 31.3 cd/m2, and the luminance of the patch on the white stripe (black–gray–black or BGB stimulus) was variable. The animal saccaded to the patch that appeared brighter. E, In the White's effect experiment, animals were allowed to freely view both stimuli. After 2–3 sec of free viewing, a fixation point appeared, and the animals had to fixate this (1.8° diameter window) for a variable interval of 1.2–1.8 sec. The animals saccaded to the brighter of the two gray patches when the fixation point was extinguished.
Fig. 2.
Fig. 2.
Brightness discrimination in two animals (PN and HN). A, The percentage of saccades to the brighter, more luminous, disk as a function of the luminance difference between disks. Different symbols indicate data collected at various mean luminance values. B, The luminance difference required to achieve 80% correct on the discrimination was linearly related to mean luminance (linear fit indicated by dashed line). The Weber fraction was 0.11 for animal PN and 0.18 for animal HN.
Fig. 3.
Fig. 3.
Brightness induction in two animals. Animals saccaded to the test or comparison disk to indicate which appeared brighter. A, Test disk luminance was 32.2 cd/m2, test surround luminance was fixed at the level indicated by the various symbols, and comparison surround luminance was 1.3 cd/m2. As the comparison disk luminance changed, the difference between comparison and test disk luminances varied (abscissa). As this difference became more positive, more saccades were made to the comparison disk, consistent with it appearing brighter. Lines drawn through the symbols are sigmoidal fits.B, The intersection between fitted curvesin A and the horizontal line at 50% was used to determine the comparison disk luminance at which the brightness of the comparison disk appeared to match the brightness of the test disk. The matching comparison disk luminances are plotted as a function of the test surround luminance. For both animals, data are shown for the 32.2 cd/m2 test disk luminance used inA (squares), and additional data with a test disk at 12.6 cd/m2 are shown for animal PN (circles).
Fig. 4.
Fig. 4.
White's effect in two animals. Animals saccaded to the gray patch on either the BGB or WGW side to indicate which patch appeared brighter. The WGW gray patch was fixed at 31.3 cd/m2, and the BGB patch luminance was varied. The percentage of saccades to the gray patch on the BGB stimulus was measured as the difference in luminance between the BGB and WGW gray patches changed. The brightness of the two patches was taken to be equal when behavioral performance was 50% (horizontal lines). When 7° long flanks were adjacent to the 2° long gray patches (open symbols and dashedsigmoidal fit curve), 50% behavioral performance was achieved when the BGB gray patch had a significantly higher luminance than the WGW patch (shift of dashed lines to theright of vertical line). The influence of the flanking lines was dramatically different when the flanks were reduced to 2° in length, matching the gray patch length (filled symbols and solid sigmoidal fit curve). The gray patches appeared to be matched in brightness when the BGB patch had a lower rather than higher luminance compared with the WGW patch.
Fig. 5.
Fig. 5.
White's effect in animal PN with two different WGW patch luminances. A, Data represented by theopen symbols and dashed sigmoidal fit come from experiments with 7° long flanks and a WGW gray patch luminance of 31.3 cd/m2. The filled symbols and solid sigmoidal fit were obtained in experiments without flanks. In this latter situation, thecurve crosses the 50% level when the gray patches have identical luminance, consistent with the task being simple brightness discrimination when there are no flanks. B, Data represented by the open symbols anddashed sigmoidal fit come from experiments with 7° long flanks and a WGW gray patch luminance of 14.1 cd/m2. The filled symbols andsolid sigmoidal fit again show simple brightness discrimination in the absence of flanks.
Fig. 6.
Fig. 6.
The role of induction in White's effect.A, In this condition from the White's effect experiment, the WGW gray patch had a luminance of 31.3 cd/m2, and the BGB patch had a luminance of 54.4 cd/m2. The black stripes were 0.2 cd/m2, and the white stripes were 81.0 cd/m2 on both sides of the stimulus. With these luminance values, the animal saccaded 65% of the time to the BGB gray patch, indicating that it appeared brighter. B, The stimulus in this condition is identical to that in A, except that the white bands on the BGB side have been reduced to 3.6 cd/m2. With this change, the animal saccaded 100% of the time to the BGB side, indicating that the gray patch on that side appeared brighter than in A. C, This stimulus was modified from A by reducing the luminance of the flanking stripes on the WGW side to 3.6 cd/m2. With this stimulus change, the animal saccaded almost equal numbers of times to the WGW and BGB gray patches.D, When the flanks on the WGW stimulus as well as the collinear bands on the BGB stimulus are darker than the gray patches, animals always saccade to the more luminous patch.

References

    1. Adelson EH. Perceptual organization and the judgement of brightness. Science. 1993;262:2042–2044. - PubMed
    1. Anderson BL. A theory of illusory lightness and transparency in monocular and binocular images: the role of contour junctions. Perception. 1997;26:419–453. - PubMed
    1. Ash P. The sensory capacities of infrahuman mammals: vision, audition, gustation. Psychol Bull. 1951;48:289–326. - PubMed
    1. Blakeslee B, McCourt ME. A multiscale spatial filtering account of the White effect, simultaneous brightness contrast and grating induction. Vision Res. 1999;39:4361–4377. - PubMed
    1. Brooks BA. Neurophysiological correlates of brightness discrimination in the lateral geniculate nucleus of the squirrel monkey. Exp Brain Res. 1966;2:1–17. - PubMed

Publication types

LinkOut - more resources