. 2002 Nov 1;22(21):9626-34.
doi: 10.1523/JNEUROSCI.22-21-09626.2002.

Induction and experience-dependent consolidation of stable long-term potentiation lasting months in the hippocampus

Affiliations

Induction and experience-dependent consolidation of stable long-term potentiation lasting months in the hippocampus

Wickliffe C Abraham et al. J Neurosci. .

Abstract

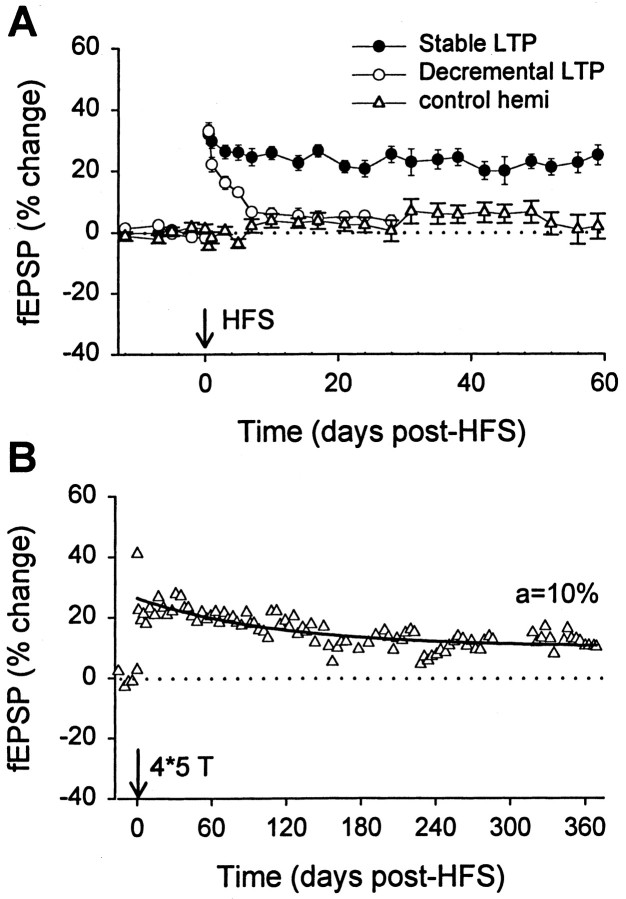
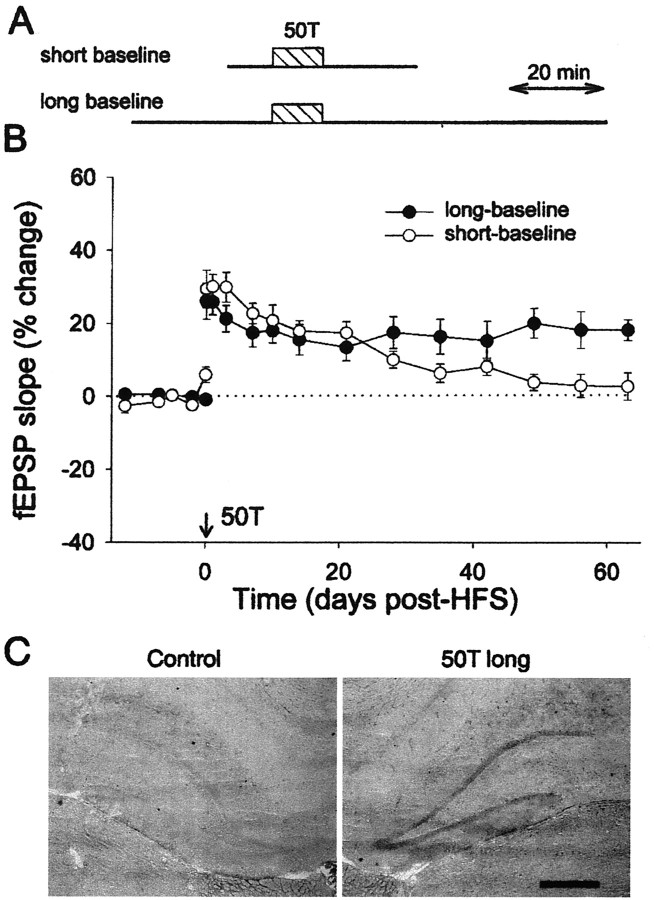
Long-term potentiation (LTP) is widely regarded as a memory mechanism, but it is not known whether it can last long enough to underlie very long-term memory. We report that high-frequency stimulation (HFS) paradigms applied to the rat dentate gyrus can elicit stable LTP lasting months and up to at least 1 year. The induction of stable LTP was sensitive to stimulation variables on the day of HFS and was associated with phosphorylation of cAMP response element-binding protein. The maintenance of stable LTP was also experience-dependent, because it was reversed when animals were exposed repeatedly to an enriched environment beginning 14 d post-HFS. However, stable LTP eventually consolidated over time and became resistant to reversal, because exposure to enriched environments 90 d post-HFS failed to influence stable LTP maintenance. Thus, LTP can be shown to meet one of the principal criteria for a very long-term memory storage mechanism. However, under naturalistic environmental conditions, LTP may normally be retained in the hippocampus for only short periods of time.


Figures

Fig. 1.
Fig. 1.
Protocol dependence of stable LTP in the dentate gyrus. A, LTP induction by different 400 Hz HFS protocols. All protocols induced a significant LTP (p < 0.05), measured 55–60 min post-HFS, that was not statistically significantly different between groups (one-way ANOVA; p > 0.1). 5T,20T, and 50T indicate the total number of 400 Hz tetanic trains, delivered as sets of five trains, 1 min apart.4*5T, Four sets of five trains delivered 10 min apart. Data are mean ± SEM. B, Summary histogram illustrating the percentage of animals showing stable LTP in the dentate gyrus for each protocol used. Both the pattern and number of stimulus trains affected the probability of stable LTP occurrence.5T, Zero of 6 animals; 20T, 1 of 6;4*5T, 3 of 6; 50T, 8 of 12.C, Decremental LTP for one animal given 4*5T (arrow). Data for both tetanized (●) and control (○) pathways are plotted. Average baseline value is represented by thedotted line. Insets are the rising phases of the fEPSPs (averages of 10 responses) before population spike onset and recorded from the tetanized hemisphere at the times indicated relative to HFS. Calibration: 2 mV, 0.5 msec. D, Stable LTP for one animal given 50T. Data for both tetanized (●) and control (○) pathways are plotted. Inset waveforms as inC. The data for the tetanized hemispheres inC and D have not been corrected for the control hemisphere changes.
Fig. 2.
Fig. 2.
Maintenance of stable LTP. A, Summary LTP persistence plot for animals receiving 20 or more stimulus trains and exhibiting >15% LTP, divided into two groups on the basis of whether the criteria for stable LTP were met (●,n = 12) or not (i.e., LTP was decremental) (○,n = 9). Data represent mean ± SEM, corrected for control pathway changes. The available control hemisphere data, combined across the two groups, are also plotted (▵;n = 9). Note the relative stability of the control hemisphere recordings. B, Stable LTP lasting 1 year post-HFS for an individual animal. Data are from the tetanized hemisphere, corrected for control pathway values that declined by ∼5% during the recording period. Solid curve is the fitted negative exponential function, with asymptote (a) of 10% LTP and decay time constant of 127 d.
Fig. 3.
Fig. 3.
Induction of stable LTP in the lateral perforant path. Plotted are the average lateral path data for three animals that showed stable LTP after 50T HFS, simultaneously to both medial and lateral paths (arrow). Data have not been corrected because no control hemisphere recordings were made. Solid curve is the fitted negative exponential function for the average plot, with a time constant of 42 d and an asymptote of 24% LTP (a value very similar to the 21% asymptote obtained by averaging the asymptotes obtained for each individual animal). A fourth animal exhibited long-lasting but decremental LTP (data not shown). Waveforms are lateral path response averages of 30 sweeps taken just before tetanization (pre), and on days 21 (d21), 63 (d63), and 101 (d101) post-HFS, for a representative animal. Calibration: 2 mV, 5 msec. Inset diagram depicts the placement of stimulating electrodes separately in the lateral (lpp) and medial (mpp) perforant paths, plus a recording electrode in the dentate hilus, below the granule cell (gc) layer of the dorsal blade.
Fig. 4.
Fig. 4.
Summary LTP persistence plots for animals receiving 50T. A, Diagram of the timing of test-pulse recording periods (and time spent in the recording chamber) and the delivery of 50T HFS for the short- and long-baseline conditions. The 50T HFS took 10 min to complete. B, Animals given 50T with the long-baseline protocol (30 and 60 min test-pulse periods before and after LTP, respectively; n = 12) generally showed stable LTP. Animals given short test-pulse periods of 10 and 20 min, respectively, showed decremental LTP for the same tetanization protocol (n = 9). The plotted data for the latter group (mean ± SEM; corrected for control pathway values) represent a combination of three animals studied in the present experiment plus six animals that received the identical protocol and were reported by Abraham et al. (1995). The maintenance of LTP was statistically different between the long- and short-baseline groups (see Results). C, pCREB immunoreactivity in the dentate granule layer at 2 hr after the 50 train long-baseline protocol, compared with the immunoreactivity found in the nontetanized hemisphere of the same animal. Scale bar, 0.5 mm.
Fig. 5.
Fig. 5.
Time-dependent reversal of stable LTP by exposure to enriched environments. A, Comparison of LTP maintenance for two groups: home cage controls (HC;n = 5) and animals receiving EE exposure for 1 hr/d for 3 weeks (EE; n = 5). The EE group showed a lasting reversal of LTP. Data are corrected for changes in the control hemisphere that have also been plotted for the EE group (n = 4). Smooth curve is the fitted negative exponential function to the HC data; asymptote = 13% LTP. B, Exposure of a separate EE group (n = 5) to the enriched environment overnight for 7 d led to a more rapid and robust reversal of LTP maintenance, compared with a new HC group (n = 6). Because of equipment malfunction, recordings were not made in two EE animals beyond 3 d after EE treatment. Data are corrected for changes in the control hemisphere that are also plotted for the EE group (n = 5). Smooth curve is the fitted negative exponential function to the HC data; asymptote = 18% LTP. C, Input–output curves for the EE group presented in B. fEPSP slopes were measured across 15 stimulus strengths (10–600 μA) and expressed as a percentage of the maximal response obtained pre-HFS. The data (uncorrected) were obtained at three time points: pre-HFS, 14 d post-HFS (pre-EE), and 21 d post-HFS (post-EE). EE exposure significantly reversed LTP across all stimulus strengths (F(2,6) = 7.30; p < 0.05). Inset waveforms are averages of 10 responses recorded during the same sessions as the input–output curves for a single animal in the EE group. Illustrated are the rising phase of the fEPSP before population spike onset for a single animal. Calibration: 3 mV, 0.5 msec.D, Overnight EE exposure failed to reverse LTP when given ∼90 d post-HFS (range 85–103 d; n = 6). For convenience, data (corrected for control hemisphere changes) have been aligned for each animal relative to the start and finish of EE exposure. All six animals received EE exposure for 1 week, and three of these animals were given EE exposure for 2 further weeks. LTP for all six animals was monitored for a further 17 d after EE treatment.

References

    1. Abraham WC, Otani S. Macromolecules and the maintenance of long-term potentiation. In: Morrell F, editor. Kindling and synaptic plasticity. Birkhäuser; Boston: 1991. pp. 92–109.
    1. Abraham WC, Demmer J, Richardson C, Williams J, Lawlor P, Mason SE, Tate WP, Dragunow M. Correlations between immediate early gene induction and the persistence of long-term potentiation. Neuroscience. 1993;56:717–727. - PubMed
    1. Abraham WC, Christie BR, Logan B, Lawlor P, Dragunow M. Immediate early gene expression associated with the persistence of heterosynaptic long-term depression in the hippocampus. Proc Natl Acad Sci USA. 1994;91:10049–10053. - PMC - PubMed
    1. Abraham WC, Mason-Parker SE, Williams J, Dragunow M. Analysis of the decremental nature of LTP in the dentate gyrus. Mol Brain Res. 1995;30:367–372. - PubMed
    1. Abraham WC, Logan BL, Greenwood J, Dragunow M. CREB phosphorylation-associated stable LTP lasting months in the hippocampus. Proc Int Australas Winter Conf Brain Res. 2001;19:41.

Publication types

Substances

LinkOut - more resources