. 2002 Nov 12;99(23):15164-9.
doi: 10.1073/pnas.192579399. Epub 2002 Nov 4.

Shape perception reduces activity in human primary visual cortex

Affiliations

Shape perception reduces activity in human primary visual cortex

Scott O Murray et al. Proc Natl Acad Sci U S A. .

Abstract

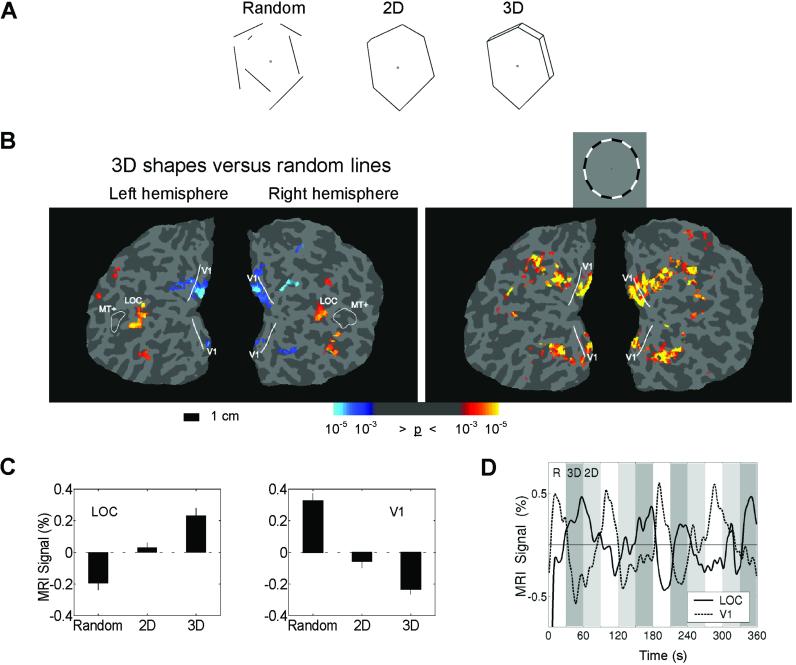
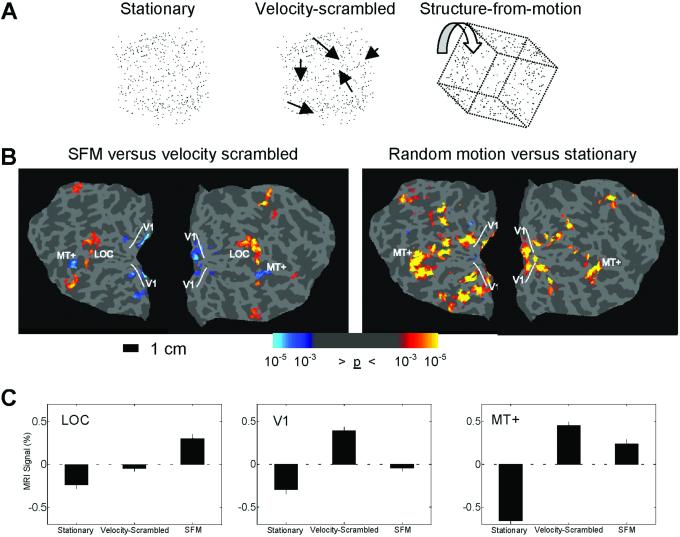
Visual perception involves the grouping of individual elements into coherent patterns that reduce the descriptive complexity of a visual scene. The physiological basis of this perceptual simplification remains poorly understood. We used functional MRI to measure activity in a higher object processing area, the lateral occipital complex, and in primary visual cortex in response to visual elements that were either grouped into objects or randomly arranged. We observed significant activity increases in the lateral occipital complex and concurrent reductions of activity in primary visual cortex when elements formed coherent shapes, suggesting that activity in early visual areas is reduced as a result of grouping processes performed in higher areas. These findings are consistent with predictive coding models of vision that postulate that inferences of high-level areas are subtracted from incoming sensory information in lower areas through cortical feedback.


Figures

Fig 1.
Fig 1.
Experiment 1. (A) Examples of the three different stimulus conditions. (B Left) Areas of increased (red/yellow) and decreased (blue) activity comparing 3D figures to random lines for a representative subject on a flattened representation of occipital cortex. (B Right) A flickering ring stimulus matching the mean eccentricity of the line drawings was used to independently locate the portion of V1 where the line drawing stimuli occurred. The reduced activity for the 3D figures in V1 is restricted to the cortical area representing the stimuli. The solid line indicates the representation of the vertical meridian, marking the boundary of V1. The location of MT+ defined by random dot motion is included as a reference. Fig. 6 shows the relative location of the ROIs and the location of the “cuts” to flatten the cortex. (C) The average percent signal change from the mean for the three conditions averaged over six subjects. All pair-wise comparisons are significant, P < 0.001. Error bars are SEM. (D) The average time course of the MRI signal in the LOC (solid line) and V1 (dashed line). Percent signal change is from the mean activation across all three conditions. Periods corresponding to the three conditions, random (R, white), 3D (dark gray), and 2D (light gray), are shown. The dissociation between the LOC and V1 is clearly evident: as activity increases in the LOC, activity in V1 declines.
Fig 2.
Fig 2.
Experiment 2. (A) The three types of random dot stimuli used in experiment 2. (B Left) Areas of increased (red/yellow) and decreased (blue) activity comparing SFM and the velocity-scrambled control stimuli. (B Right) V1 and MT+ were defined in a separate scan by using a randomly moving dot field compared with stationary dots. The area of decreased activity in V1 to the SFM stimuli was restricted to the region independently defined by the random motion stimulus. (C) The percent signal change averaged over six subjects in the LOC, V1, and MT+. Activity increased in all three areas in motion conditions relative to the stationary condition. The critical comparison in this experiment is between the velocity-scrambled and SFM conditions. LOC activity increased to the SFM stimulus compared with the velocity-scrambled stimuli, whereas V1 and MT+ showed significant activity reductions. All pair-wise comparisons are significant, P < 0.001. Error bars are SEM.
Fig 3.
Fig 3.
Experiment 3. (A) A red diamond was covered by three black bars that hid the four vertices. There were two stimulus conditions in which either the red diamond moved or the three occluding black bars moved horizontally back and forth, as shown in B (diamond moves) and C (bars move), respectively. Left and Right in B and C show the first and last movie frame. The four remaining line segments could be perceived either as a rigid diamond moving horizontally or as individual line segments moving vertically. See Movies 1 and 2 for examples of the diamond moves stimulus. (D) Activity time course of voxels in V1 (thin red lines) and the superimposed simulated response (thick gray lines) for two subjects. Scan 3 for both subjects was used to choose significantly correlated voxels (Upper). (Lower) The fit for one of the other three scans. (E) ROC curves quantifying the predictability of the perceptual transition from diamond to nondiamond from fluctuations in V1 activity. In all scans for both subjects, V1 activity was an accurate predictor of subjects' perceptual state.

References

    1. Knierim J. J. & Van Essen, D. C. (1992) J. Neurophysiol. 67, 164-181. - PubMed
    1. Das A. & Gilbert, C. D. (1999) Nature 399, 655-661. - PubMed
    1. Hupe J. M., James, A. C., Payne, B. R., Lomber, S. G., Girard, P. & Bullier, J. (1998) Nature 394, 784-787. - PubMed
    1. Pearl J., (1988) Probabilistic Reasoning in Intelligent Systems: Networks of Plausible Inference (Morgan Kaufmann, San Francisco).
    1. Mumford D. (1992) Biol. Cybern. 66, 241-251. - PubMed

Publication types

LinkOut - more resources