

Expression profiling of CD34+ hematopoietic stem/ progenitor cells reveals distinct subtypes of therapy-related acute myeloid leukemia
- PMID: 12417757
- PMCID: PMC137521
- DOI: 10.1073/pnas.222491799
Expression profiling of CD34+ hematopoietic stem/ progenitor cells reveals distinct subtypes of therapy-related acute myeloid leukemia
Abstract
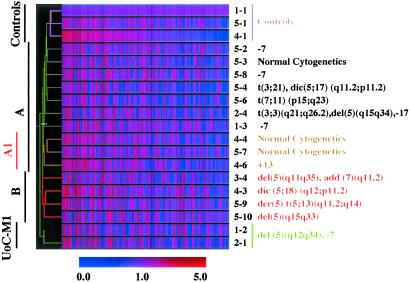
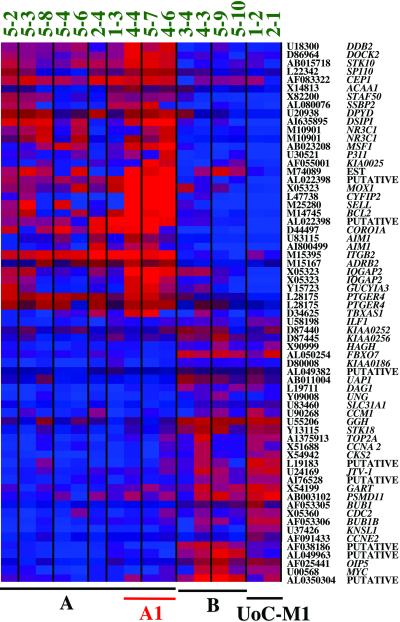
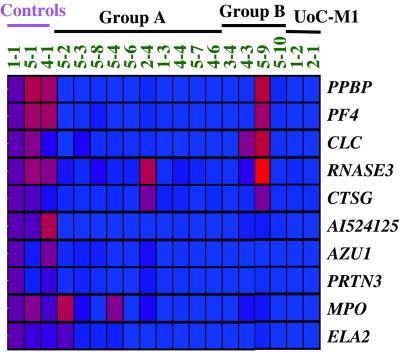
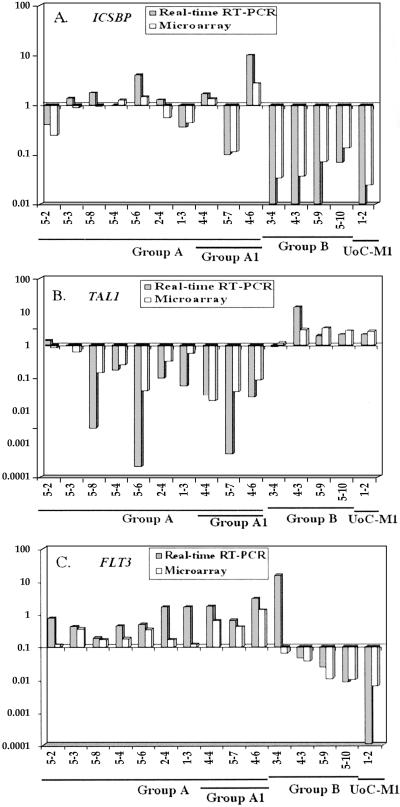
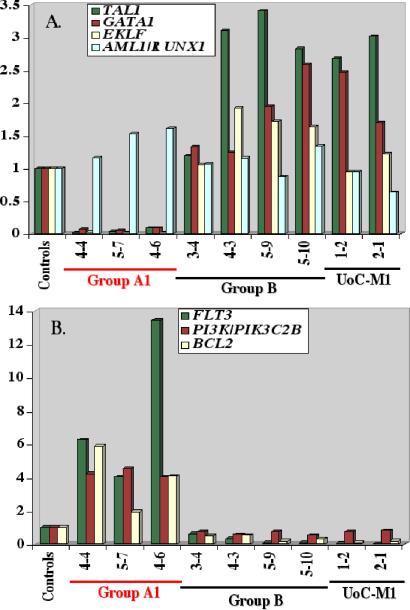
One of the most serious consequences of cytotoxic cancer therapy is the development of therapy-related acute myeloid leukemia (t-AML), a neoplastic disorder arising from a multipotential hematopoietic stem cell. To gain insights into the molecular basis of this disease, we performed gene expression profiling of CD34(+) hematopoietic progenitor cells from t-AML patients. Our analysis revealed that there are distinct subtypes of t-AML that have a characteristic gene expression pattern. Common to each of the subgroups are gene expression patterns typical of arrested differentiation in early progenitor cells. Leukemias with a -5/del(5q) have a higher expression of genes involved in cell cycle control (CCNA2, CCNE2, CDC2), checkpoints (BUB1), or growth (MYC), and loss of expression of the gene encoding IFN consensus sequence-binding protein (ICSBP). A second subgroup of t-AML is characterized by down-regulation of transcription factors involved in early hematopoiesis (TAL1, GATA1, and EKLF) and overexpression of proteins involved in signaling pathways in myeloid cells (FLT3) and cell survival (BCL2). Establishing the molecular pathways involved in t-AML may facilitate the identification of selectively expressed genes that can be exploited for the development of urgently needed targeted therapies.
Figures
Similar articles
-
Therapy-related myeloid leukaemia: a model for leukemogenesis in humans.Chem Biol Interact. 2005 May 30;153-154:187-95. doi: 10.1016/j.cbi.2005.03.023. Epub 2005 Apr 13. Chem Biol Interact. 2005. PMID: 15935816
-
Pegylated granulocyte colony-stimulating factor mobilizes CD34+ cells with different stem and progenitor subsets and distinct functional properties in comparison with unconjugated granulocyte colony-stimulating factor.Haematologica. 2008 Mar;93(3):347-55. doi: 10.3324/haematol.12081. Epub 2008 Feb 11. Haematologica. 2008. PMID: 18268278
-
Expression profiling reveals fundamental biological differences in acute myeloid leukemia with isolated trisomy 8 and normal cytogenetics.Proc Natl Acad Sci U S A. 2001 Jan 30;98(3):1124-9. doi: 10.1073/pnas.98.3.1124. Proc Natl Acad Sci U S A. 2001. PMID: 11158605 Free PMC article.
-
Expression of FLT3 receptor and response to FLT3 ligand by leukemic cells.Leukemia. 1996 Apr;10(4):588-99. Leukemia. 1996. PMID: 8618433 Review.
-
Cytogenetic and genetic pathways in therapy-related acute myeloid leukemia.Chem Biol Interact. 2010 Mar 19;184(1-2):50-7. doi: 10.1016/j.cbi.2009.11.025. Epub 2009 Dec 1. Chem Biol Interact. 2010. PMID: 19958752 Free PMC article. Review.
Cited by
-
Breast cancer stem cells: Multiple capacities in tumor metastasis.Cancer Lett. 2014 Jul 10;349(1):1-7. doi: 10.1016/j.canlet.2014.03.036. Epub 2014 Apr 12. Cancer Lett. 2014. PMID: 24727284 Free PMC article. Review.
-
Apoptosis and antiapoptotic mechanisms in the progression of myelodysplastic syndrome.Exp Hematol. 2007 Nov;35(11):1739-46. doi: 10.1016/j.exphem.2007.09.007. Exp Hematol. 2007. PMID: 17976524 Free PMC article. Review.
-
Cytotoxic Therapy-Induced Effects on Both Hematopoietic and Marrow Stromal Cells Promotes Therapy-Related Myeloid Neoplasms.Blood Cancer Discov. 2020 Jul;1(1):32-47. doi: 10.1158/2643-3230.BCD-19-0028. Blood Cancer Discov. 2020. PMID: 32924016 Free PMC article.
-
Targeting CDK1 promotes FLT3-activated acute myeloid leukemia differentiation through C/EBPα.J Clin Invest. 2012 Aug;122(8):2955-66. doi: 10.1172/JCI43354. Epub 2012 Jul 17. J Clin Invest. 2012. PMID: 22797303 Free PMC article.
-
Phosphatidylinositol 3-kinase, class 2 beta (PI3KC2β) isoform contributes to neuroblastoma tumorigenesis.Cancer Lett. 2015 Apr 10;359(2):262-8. doi: 10.1016/j.canlet.2015.01.026. Epub 2015 Jan 23. Cancer Lett. 2015. PMID: 25622909 Free PMC article.
References
-
- Thirman M. J. & Larson, R. A. (1996) Hematol. Oncol. Clin. North Am. 10, 293-320. - PubMed
-
- Smith M. A., McCaffrey, R. P. & Karp, J. E. (1996) J. Natl. Cancer Inst. 88, 407-418. - PubMed
-
- Godley L. A. & Larson, R. A. (2001) in The Myelodysplastic Syndromes: Pathobiology and Clinical Management, ed. Bennett, J. M. (Dekker, New York), pp. 139–176.
-
- Pedersen-Bjergaard J. & Rowley, J. D. (1994) Blood 83, 2780-2786. - PubMed
-
- Golub T. R., Slonim, D. K., Tamayo, P., Huard, C., Gaasenbeek, M., Mesirov, J. P., Coller, H., Loh, M. L., Downing, J. R., Caligiuri, M. A., et al. (1999) Science 286, 531-537. - PubMed
Publication types
MeSH terms
Substances
Grants and funding
LinkOut - more resources
Full Text Sources
Other Literature Sources
Medical
Miscellaneous
