. 2002 Nov 12;99(23):15089-94.
doi: 10.1073/pnas.222550499. Epub 2002 Nov 4.

Antiepileptic drugs and apoptotic neurodegeneration in the developing brain

Affiliations

Antiepileptic drugs and apoptotic neurodegeneration in the developing brain

Petra Bittigau et al. Proc Natl Acad Sci U S A. .

Abstract

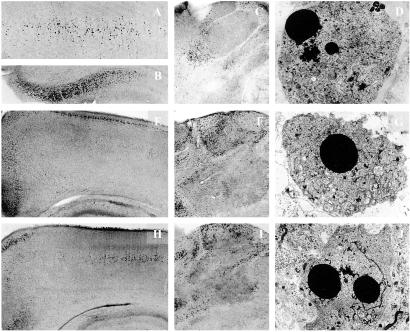
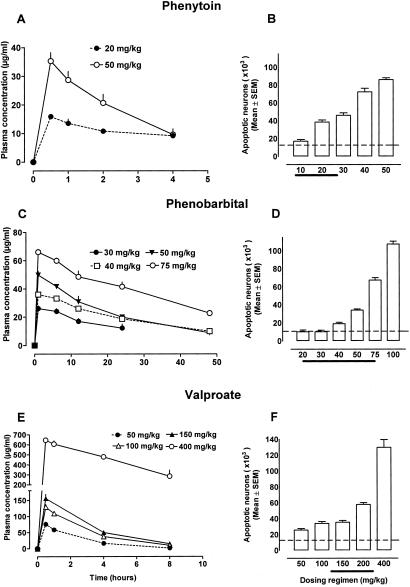
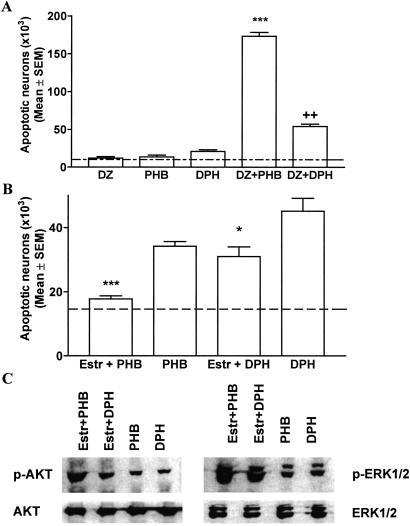
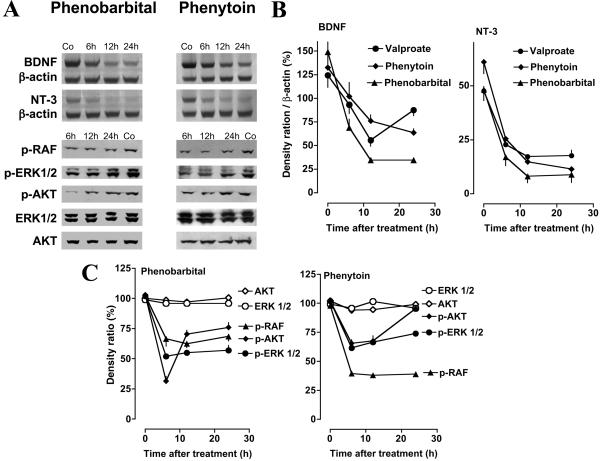
Epilepsy is the most common neurological disorder of young humans. Each year 150,000 children in the United States experience their first seizure. Antiepileptic drugs (AEDs), used to treat seizures in children, infants, and pregnant women, cause cognitive impairment, microcephaly, and birth defects. The cause of unwanted effects of therapy with AEDs is unknown. Here we reveal that phenytoin, phenobarbital, diazepam, clonazepam, vigabatrin, and valproate cause apoptotic neurodegeneration in the developing rat brain at plasma concentrations relevant for seizure control in humans. Neuronal death is associated with reduced expression of neurotrophins and decreased concentrations of survival-promoting proteins in the brain. beta-Estradiol, which stimulates pathways that are activated by neurotrophins, ameliorates AED-induced apoptotic neurodegeneration. Our findings present one possible mechanism to explain cognitive impairment and reduced brain mass associated with prenatal or postnatal exposure of humans to antiepileptic therapy.


Figures

Fig 1.
Fig 1.
Light microscopic overviews of silver-stained transverse sections and electron micrographs depicting neurodegenerative changes in the brains of P8 rats after treatment with phenytoin (AD), diazepam (EG), or valproate (HJ). (AC) Layer IV of the parietal cortex (A, ×40), the subiculum (B, ×40), and the thalamus (C, ×25) of P8 rats treated 24 h previously with phenytoin (50 mg/kg). (E and F) Low-magnification (×25) light microscopic overviews of silver-stained sections from the parietal and cingulate cortices (E) and the thalamus (F) of P8 rats treated 24 h previously with diazepam (30 mg/kg). (H and I) Low-magnification (×25) light microscopic overviews of silver-stained sections from the parietal and cingulate cortices (H) and the thalamus (I) of P8 rats treated 24 h previously with valproate (200 mg/kg). Degenerating neurons (small dark dots) are sparsely present after treatment with saline in those same brain regions but abundantly present after treatment with phenytoin, diazepam, or valproate. (D, G, and J) Electron micrographs (×1,800) illustrating late stages of apoptotic neurodegeneration within the thalamus 24 h after administration of phenytoin (D), diazepam (G), or valproate (J) to rats on P7.
Fig 2.
Fig 2.
Phenytoin (10–50 mg/kg), phenobarbital (30–75 mg/kg), or valproate (50–400 mg/kg) were administered to P7 rats. (A, C, and E) Phenytoin, phenobarbital, and valproate plasma concentrations associated with each of the several dosing regimens. Dotted lines represent threshold levels for triggering an apoptotic response. (B, D, and F) Severity of apoptotic neurodegeneration associated with each dose-plasma concentration curve. Severity of degeneration was established as described in Materials and Methods. Histographic values in B, D, and F represent cumulative scores for apoptotic brain damage (means ± SEM, n = 6 per group) in the forebrains of treated rats. Dotted lines in B, D, and F represent the mean score for apoptotic neurons in saline-treated rats. ANOVA revealed a significant effect of treatment with phenytoin [F(1,50) = 703.8, P < 0.0001], phenobarbital [F(1,60) = 555.1, P < 0.0001], and valproate [F(1,50) = 356.0, P < 0.0001] with multiple comparisons showing that the doses of 20 mg/kg phenytoin, 40 mg/kg phenobarbital, and 50 mg/kg valproate significantly increased apoptosis. Thick lines at the x coordinate indicate reported ED50 doses of the corresponding drug in various rodent seizure models. ED50 is defined as the dose that blocks seizures in 50% of tested animals.
Fig 3.
Fig 3.
(A) Combinations of AEDs elicit neurotoxic effects. Diazepam (DZ, 5 mg/kg), phenobarbital (PHB, 20 mg/kg), and phenytoin (DPH, 20 mg/kg) were administered alone or in combination to P7 rats. Severity of degeneration was established as described in Materials and Methods. Histographic values represent cumulative scores for apoptotic damage (means ± SEM, n = 6 per group) in the forebrains of treated rats on P8. Dotted line represents the mean apoptotic score in saline-treated rats. Whereas these doses of AEDs alone elicited no or minimal neurotoxic response, their combination resulted in severe apoptotic neurodegeneration (***, P < 0.001 compared with DZ- and PHB-treated rats; ††, P < 0.01 compared with DPH-treated rats, Student′s t test). (B) β-Estradiol (Estr) ameliorates apoptotic response to phenobarbital (PHB) and phenytoin in P7 rats. Saline or β-estradiol (300 μg/kg) were administered s.c. to P6 rats in three injections 8 h apart. Pups received i.p. injection of phenobarbital (50 mg/kg) or phenytoin (30 mg/kg) on P7 and the brains were analyzed on P8. Histographic values represent cumulative scores for brain damage (means ± SEM, n = 6 per group) in the forebrains of treated rats on P8. The scores illustrate that there are fewer apoptotic neurons in the brains of β-estradiol-treated rats compared with saline-treated rats (***, P < 0.001 for phenobarbital; *, P < 0.05 for phenytoin, Student′s t test). (C) β-Estradiol increases protein levels for p-ERK1/2 and p-AKT but does not alter total protein levels in the thalamus of rats treated with phenobarbital (50 mg/kg) or phenytoin (50 mg/kg). Immunoblotting was performed with antiphospho-ERK1/2, antiphospho-AKT, ERK1/2 (phosphorylation state independent), or AKT (phosphorylation state independent) antibodies. Blots are representative of a series of four blots for each antibody and each treatment condition.
Fig 4.
Fig 4.
(A) Phenobarbital and phenytoin decrease mRNA levels for BDNF and NT-3 and decrease phosphorylation of c-RAF, ERK1/2, and AKT in the neonatal brain. P7 pups received i.p. injection of phenobarbital (50 mg/kg), phenytoin (40 mg/kg), or vehicle (Co). Brain tissue from the thalamus was dissected at the various times indicated. Decreased density of the BDNF- and NT-3-specific bands is evident at 6, 12, and 24 h after administration of AEDs. Immunoblotting was performed with antiphospho-RAF, antiphospho-ERK1/2, antiphospho-AKT, ERK1/2 (phosphorylation state independent), or AKT (phosphorylation state independent) antibodies. There is a decrease in the levels of p-RAF, p-ERK1/2, and p-AKT at 6 h after injection of AEDs, whereas ERK1/2 and AKT (phosphorylation independent) are unaffected. (B) Quantitation of suppression by AEDs of mRNA levels for BDNF and NT-3 in the thalamus of infant rats. P7 pups received injection of phenobarbital (50 mg/kg, n = 9), phenytoin (50 mg/kg, n = 9), valproate (200 mg/kg, n = 9), or vehicle (n = 9) and were killed at 6, 12, or 24 h after treatment (n = 3 per group). mRNA levels for BDNF, NT-3, and β-actin were analyzed by means of PAGE and densitometrically quantitated. Values represent mean normalized ratios of the BDNF and NT-3 bands to β-actin (n = 3 per point ± SEM). ANOVA revealed that there was a significant effect of treatment with AEDs on BDNF [F(1,12)valproate = 29.79, P < 0.0001; F(1,12)phenytoin = 5.492, P < 0.05; F(1,12)phenobarbital = 838.2, P < 0.0001] and NT-3 [F(1,12)valproate = 283.9, P < 0.0001; F(1,12)phenytoin = 167.3, P < 0.0001; F(1,12)phenobarbital = 109.2, P < 0.0001] levels. (C) Quantitation of suppression by AEDs of protein levels of p-RAF, p-ERK1/2, and p-AKT in the thalamus of infant rats. P7 pups received injection of phenobarbital (50 mg/kg, n = 16), phenytoin (50 mg/kg, n = 16), or vehicle (n = 16) and were killed at 0, 6, 12, or 24 h after treatment (n = 4 per group). Protein levels for p-RAF, p-ERK1/2, p-AKT, ERK1/2, and AKT were analyzed by Western blotting and densitometrically quantitated. Values represent the mean normalized values of the densities of p-RAF, p-ERK1/2, p-AKT, ERK1/2, and AKT bands compared with the density of the respective band at 0 h (percent; n = 4 per point ± SEM). ANOVA revealed that there was a significant effect of treatment with AEDs on p-RAF [F(1,24)phenobarbital = 115.9, P < 0.0001; F(1,24)phenytoin = 3,206, P < 0.0001], p-ERK1/2 [F(1,24)phenobarbital = 477.4, P < 0.0001; F(1,24)phenytoin = 478.7, P < 0.0001] and p-AKT [F(1,24)phenobarbital = 254.3, P < 0.0001; F(1,24)phenytoin = 96.69, P < 0.0001] levels. ERK1/2 and AKT levels were not affected by treatment.

References

    1. Hauser W. A. (1994) Epilepsia 35, Suppl. 2, S1-S6. - PubMed
    1. Taylor C. P. & Meldrum, B. S. (1995) Trends Pharmacol. Sci. 16, 309-316. - PubMed
    1. Meldrum B. S. (1996) Epilepsia 37, Suppl. 6, S4-S11. - PubMed
    1. Brodie M. J. & Dichter, M. A. (1996) N. Engl. J. Med. 334, 168-175. - PubMed
    1. Gidal B. E., Privitera, M. D., Sheth, R. D. & Gilman, J. T. (1999) Ann. Pharmacother. 33, 1277-1286. - PubMed

Publication types

MeSH terms

LinkOut - more resources