Comparative Study
. 2002 Nov;12(11):1625-41.
doi: 10.1101/gr.221202.

Structural characterization of the human proteome

Affiliations
Comparative Study

Structural characterization of the human proteome

Arne Müller et al. Genome Res. 2002 Nov.

Abstract

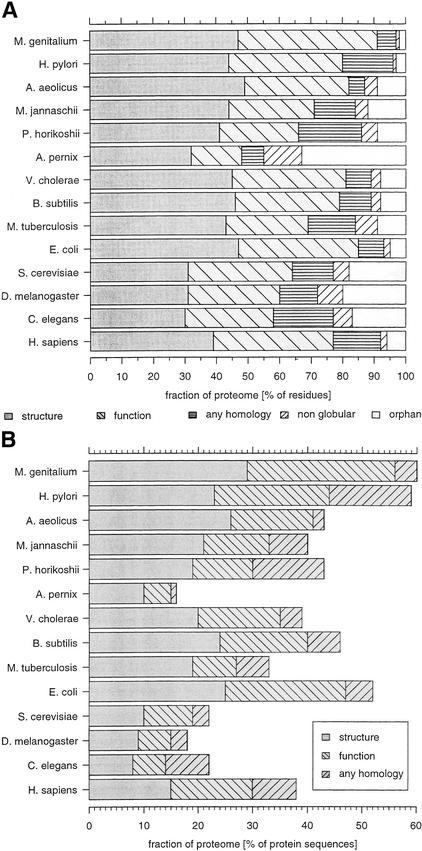
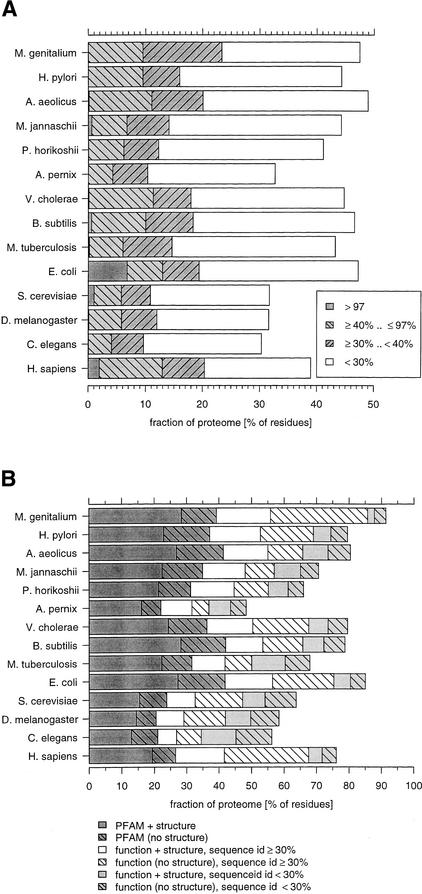
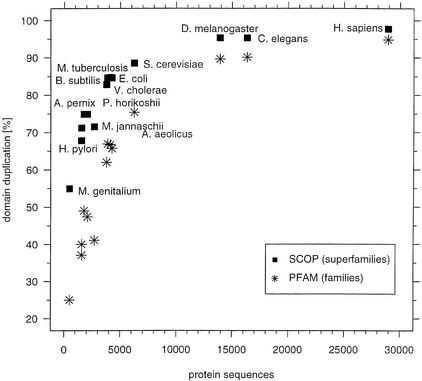
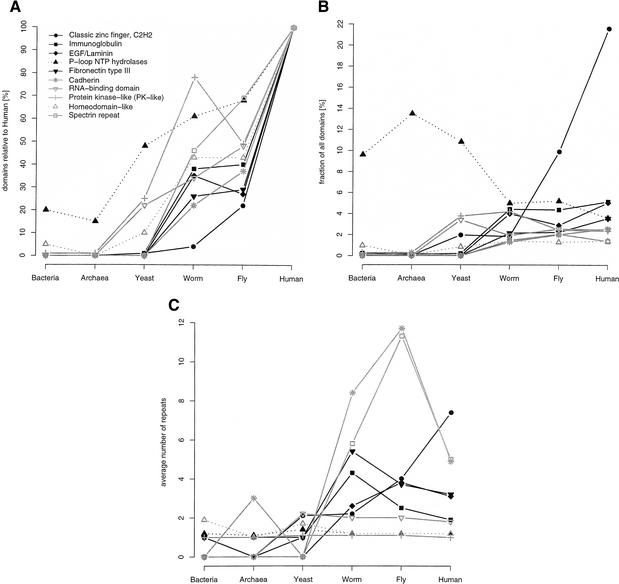
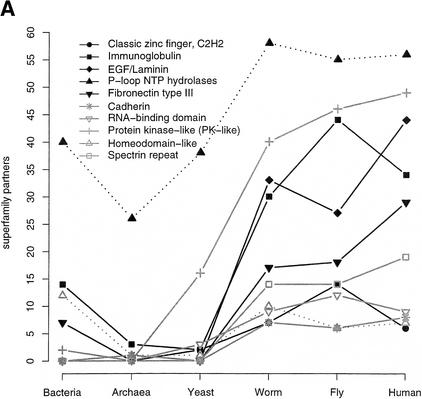
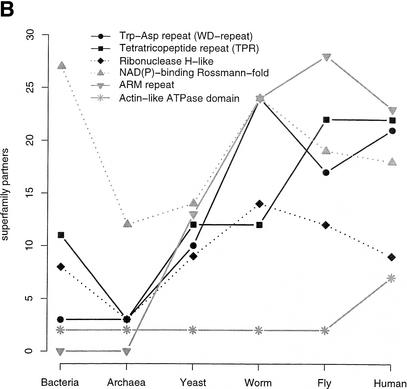
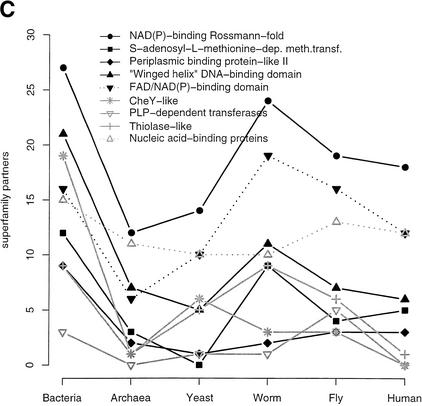
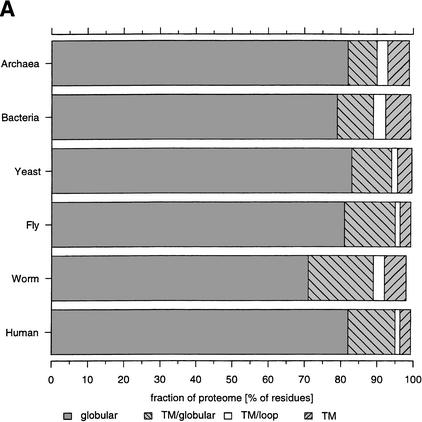
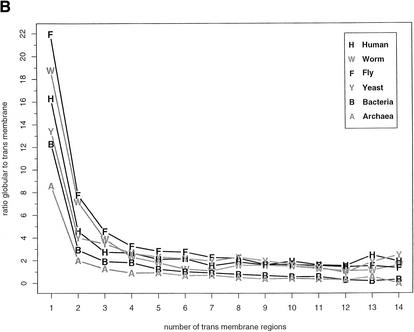
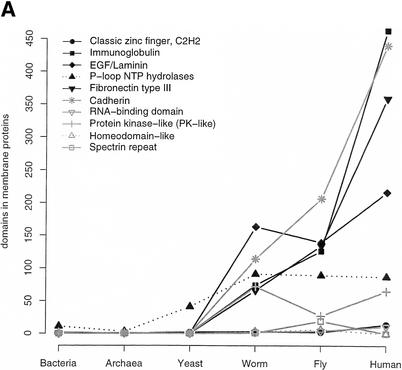
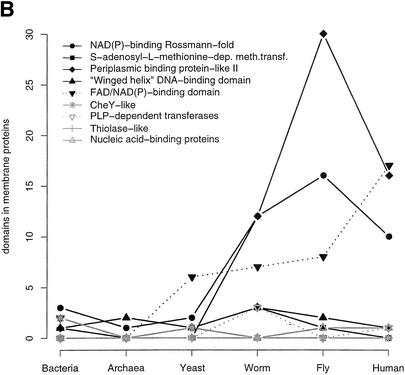
This paper reports an analysis of the encoded proteins (the proteome) of the genomes of human, fly, worm, yeast, and representatives of bacteria and archaea in terms of the three-dimensional structures of their globular domains together with a general sequence-based study. We show that 39% of the human proteome can be assigned to known structures. We estimate that for 77% of the proteome, there is some functional annotation, but only 26% of the proteome can be assigned to standard sequence motifs that characterize function. Of the human protein sequences, 13% are transmembrane proteins, but only 3% of the residues in the proteome form membrane-spanning regions. There are substantial differences in the composition of globular domains of transmembrane proteins between the proteomes we have analyzed. Commonly occurring structural superfamilies are identified within the proteome. The frequencies of these superfamilies enable us to estimate that 98% of the human proteome evolved by domain duplication, with four of the 10 most duplicated superfamilies specific for multicellular organisms. The zinc-finger superfamily is massively duplicated in human compared to fly and worm, and occurrence of domains in repeats is more common in metazoa than in single cellular organisms. Structural superfamilies over- and underrepresented in human disease genes have been identified. Data and results can be downloaded and analyzed via web-based applications at http://www.sbg.bio.ic.ac.uk.


Figures

Figure 1
Figure 1
Structural and functional annotation of the proteomes. (A) Coverage for each species is reported as the fraction of the residues in the proteome that are annotated. This allows for partial coverage of any sequence. Structural annotation is a homology to a known structure. Functional annotation is when there is no structural annotation but there is a homology to an entry from SwissProt or PIR that has a description other than those that contain any of the following words: “hypothetical”, “probable”, “putative”, “predicted”. Any homology denotes a sequence similarity to a structurally or functionally unannotated protein, such as one described as hypothetical. Nonglobular denotes remaining sequence regions that were predicted as transmembrane, signal peptide, coiled-coils, or low-complexity. Remaining residues are classified as orphans. (B) Structural and functional annotations that cover the entire protein sequence. For structural annotation, we required that >95% of the sequence was structurally annotated and there was no unannotated segment of >30 residues. Functional annotation is evaluated after assigning structures and requires the same constraints. Finally, any homolog (including those of unknown function) is assigned to the remainder (with the same sequence length constraints).
Figure 2
Figure 2
Reliability of annotation. (A) Reliability of structural annotation. Homologies are dissected into sequence similarity bands. The >97% identity effectively reports a match to an experimentally determined structure or to one that differs in only a few residues. Structures based on these annotations are accurate. The next band down to 40% denotes annotations for which models can be constructed that are expected to be reasonably accurate (Sanchez and Sali 1998; Bates and Sternberg 1999). Between 40% and 30% sequence identity automated modeling is difficult. Below 30% identity, the sequence alignment suggested by the annotation is expected to have many errors and the structural annotation primarily provides an indication of the 3-D fold. (B) Reliability of functional annotation. Functional annotation is distinguished between reliable (≥30% sequence identity) and “fuzzy” (<30% sequence identity). The fractions are cumulative, that is, regions that are assigned to a PFAM domain and a structure are counted first, then we count regions for which we have a PFAM domain but no structural assignment.
Figure 3
Figure 3
Extent of domain duplication in different proteomes. The extent of duplication is estimated from the frequencies of observing domains in the different SCOP superfamilies and is shown as the fraction of total assigned domains for each proteome. The size of the human proteome is estimated at the number of protein sequences in the ENSEMBL dataset (∼29,000). Comparable results from frequencies of PFAM families (Bateman et al. 2000) are reported.
Figure 4
Figure 4
Expansion of SCOP superfamilies. The 10 most abundant human superfamilies are shown. (A) Superfamily expansion relative to the human proteome. The expansion of a superfamily relative to the human proteome is plotted as the number of domains in superfamily X in proteome Y divided by the number of domains in superfamily X in human (times 100), so that all superfamilies are 100% in human. (B) Relative superfamily expansion. Number of domains in a superfamily normalized by the number of domains in all superfamilies for a proteome (multiplied by 100). (C) Average repetitiveness of superfamilies. For each superfamily, the number of domains divided by the number of sequences this superfamily is found in is plotted.
Figure 5
Figure 5
SCOP superfamily partners. The plots show the number of different SCOP superfamilies that are found together in the same sequence with a given superfamily, including the superfamily itself and irrespective of the order or sequence space between domains. This implies that at least two domains have to be identified in a sequence. Superfamily partners for the 10 most abundant superfamilies in human (A), in yeast (B) and bacteria (C) are plotted. Only those superfamilies not found within the first 10 ranks in human are shown in B (P-loop, protein kinase-like, tetratricopeptide repeat, and the classic zinc finger) and C (P-loop rank one in bacteria).
Figure 5
Figure 5
SCOP superfamily partners. The plots show the number of different SCOP superfamilies that are found together in the same sequence with a given superfamily, including the superfamily itself and irrespective of the order or sequence space between domains. This implies that at least two domains have to be identified in a sequence. Superfamily partners for the 10 most abundant superfamilies in human (A), in yeast (B) and bacteria (C) are plotted. Only those superfamilies not found within the first 10 ranks in human are shown in B (P-loop, protein kinase-like, tetratricopeptide repeat, and the classic zinc finger) and C (P-loop rank one in bacteria).
Figure 6
Figure 6
Distribution of transmembrane and globular regions in the proteomes. (A) Fractions of globular and nonglobular parts in membrane proteins. Globular denotes globular domains in nontransmembrane proteins, TM/Globular are globular regions within transmembrane helix containing proteins, TM/Loop are short loops in transmembrane proteins, and TM are the actual transmembrane helices. (B) Ratio of globular regions to transmembrane regions in membrane sequences classified according to the number of transmembrane regions. The diagram only shows ratios for which at least nine transmembrane proteins were found.
Figure 6
Figure 6
Distribution of transmembrane and globular regions in the proteomes. (A) Fractions of globular and nonglobular parts in membrane proteins. Globular denotes globular domains in nontransmembrane proteins, TM/Globular are globular regions within transmembrane helix containing proteins, TM/Loop are short loops in transmembrane proteins, and TM are the actual transmembrane helices. (B) Ratio of globular regions to transmembrane regions in membrane sequences classified according to the number of transmembrane regions. The diagram only shows ratios for which at least nine transmembrane proteins were found.
Figure 7
Figure 7
Expansion of SCOP superfamilies in membrane proteins. The number of domains in a superfamily that are found in proteins that have at least one transmembrane helix are shown for the different proteomes. The 10 overall most abundant superfamilies in human (A), as in Figure 4, and bacteria (B) are plotted. The P-loop is excluded from B, as it is already shown in A.
Figure 7
Figure 7
Expansion of SCOP superfamilies in membrane proteins. The number of domains in a superfamily that are found in proteins that have at least one transmembrane helix are shown for the different proteomes. The 10 overall most abundant superfamilies in human (A), as in Figure 4, and bacteria (B) are plotted. The P-loop is excluded from B, as it is already shown in A.

Similar articles

Cited by

References

    1. Aloy P, Querol E, Aviles FX, Sternberg MJE. Automated structure-based prediction of functional sites in proteins—Applications to assessing the validity of inheriting protein function from homology in genome annotation and to protein docking. J Mol Biol. 2001;311:395–408. - PubMed
    1. Altschul SF, Madden TL, Schaffer AA, Zhang J, Zhang Z, Miller W, Lipman DJ. Gapped BLAST and PSI-BLAST: A new generation of protein data base search programs. Nucleic Acids Res. 1997;25:3389–3402. - PMC - PubMed
    1. Antonarakis SE, McKusick VA. OMIM passes the 1,000-disease-gene mark. Nat Genet. 2000;25:11. - PubMed
    1. Apic G, Gough J, Teichmann SA. Domain combinations inarchaeal, eubacterial and eukaryotic proteomes. J Mol Biol. 2001;310:311–325. - PubMed
    1. Bargmann CI. Neurobiology of the Caenorhabditis elegans genome. Science. 1998;282:2028–2033. - PubMed

Publication types

MeSH terms

LinkOut - more resources