Comparative Study
. 2002 Nov 15;21(22):6072-82.
doi: 10.1093/emboj/cdf594.

Clathrin light and heavy chain interface: alpha-helix binding superhelix loops via critical tryptophans

Affiliations
Comparative Study

Clathrin light and heavy chain interface: alpha-helix binding superhelix loops via critical tryptophans

Chih-Ying Chen et al. EMBO J. .

Abstract

Clathrin light chain subunits (LCa and LCb) contribute to regulation of coated vesicle formation to sort proteins during receptor-mediated endocytosis and organelle biogenesis. LC binding to clathrin heavy chain (HC) was characterized by genetic and structural approaches. The core interactions were mapped to HC residues 1267-1522 (out of 1675) and LCb residues 90-157 (out of 228), using yeast two-hybrid assays. The C-termini of both subunits also displayed interactions extending beyond the core domains. Mutations to helix breakers within the LCb core disrupted HC association. Further suppressor mutagenesis uncovered compensatory mutations in HC (K1415E or K1326E) capable of rescuing the binding defects of LCb mutations W127R or W105R plus W138R, thereby pinpointing contacts between HC and LCb. Mutant HC K1415E also rescued loss of binding by LCa W130R, indicating that both LCs interact similarly with HC. Based on circular dichroism data, mapping and mutagenesis, LCa and LCb were represented as alpha-helices, aligned along the HC and, using molecular dynamics, a structural model of their interaction was generated with novel implications for LC control of clathrin assembly.


Figures
None
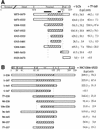
Fig. 1. Mapping minimal regions of clathrin HC and LC interaction. (A) Yeast SFY526 cells were co-transformed with the indicated bovine HC fragments (in pGBT9) plus full-length bovine brain LCb or the LCb fragment 77–165 (in pACT2). Quantitative β-galactosidase (β-gal) assays were performed, and results are shown in units as the mean ± SD of triplicate determinations. Above the fragments tested, a diagram of full-length HC is delineated, indicating the terminal, distal, proximal, trimerization and extreme C-terminal domains (Txd + C). Black bars below the HC diagram indicate sites previously implicated in LC binding (1213–1313, 1438–1481 and 1513–1522) (Näthke et al., 1992; Liu et al., 1995). Hatched lines within each fragment highlight the boundaries of the minimal region in HC (1267–1522) required for LC binding, mapped by these studies. (B) SFY526 cells were co-transformed with bovine HC fragment 1204–1522 (in pGBT9) and the indicated bovine brain LCb fragments (in pGAD424). Results of liquid β-gal assays are shown in units as the mean ± SD of triplicate determinations. Above the fragments tested, a diagram of full-length bovine brain LCb is delineated, indicating the phosphorylation domain (P), conserved region (Cons), calcium-binding site (Ca), previously predicted HC-binding site (HC), neuron-specific insert (N) and calmodulin-binding site (Cam). Hatched lines within each fragment highlight the boundaries of the minimal region in LCb (90–157) required for HC binding, mapped by these studies. The β-gal units shown in (A) are generally higher than those in (B) because LC fragments were constructed in different prey vectors in which pACT2 (for A) has a higher expression level than pGAD424 (for B).
None
Fig. 2. Parallel interaction at the C-termini of clathrin heavy and light chains. Plate growth and β-galactosidase (β-gal) filter assays for the interactions between HC 1523–1675 and various LCb fragments. The boundaries of the LCb fragments tested are diagrammed relative to the full-length LCb sequence, with the functional domains delineated as defined in Figure 1B. For the plate growth assay, yeast AH109 cells were co-transformed with HC 1523–1675 (in pGBT9) and the indicated LCb fragments (in pACT2). The transformants were spotted onto plates lacking Leu and Trp, with (+) or without (–) His and Ade. Trans formants expressing interacting constructs grew in the absence of His and Ade after 3–5 days. For the β-gal filter assay, SFY526 cells were co-transformed with HC 1523–1675 (in pGBT9) and the indicated LCb fragments (in pACT2). Transformants were spotted onto filters directly in contact with media and incubated for 2 days. Blue color indicating positive interaction developed within 6 h following substrate application in the filter assay. The assays shown are typical of three independent experiments.
None
Fig. 3. Requirement for an α-helical conformation of clathrin LC during interaction with HC. (A) Sequences of the mutant fragments of bovine brain LCb 77–157 that were unable to bind HC. Yeast AH109 cells harboring HC 1204–1522 (in pGBT9) were co-transformed with mutated PCR products of LCb 77–157 and a gapped prey vector, pGAD424. The inserts of the recombinant clones (numbered mutants) unable to interact with HC 1204–1522 were sequenced. Mutated residues are in color and, among those, helix breakers are shown in green. (B) Far-UV CD spectra of LCb in the presence of TFE. Samples of LCb at a final concentration of 1.5 µM were incubated in 20 mM sodium phosphate buffer pH 7.1 with varying concentrations of TFE (0–60% v/v). CD intensity is represented as mean residue molar ellipticity. (C) Gain of signal for the LCb–proximal leg complex recorded by far-UV CD. The concentration of each indicated protein was 0.5 µM in 20 mM sodium phosphate buffer pH 7.1. The spectra of the isolated components, LCb, proximal leg and the complex are shown. The sum of the spectra of the two isolated proteins is also shown for comparison (dotted line). To facilitate the direct comparison of components with different numbers of residues, the CD intensity was calculated using the protein molar concentration rather than on a per residue basis.
None
Fig. 4. Mutation of tryptophan to arginine at clathrin LC residue 127 in LCb or 130 in LCa abrogates binding to HC, which is rescued by HC mutation K1415E. (A) Plate growth assay of yeast AH109 cells co-transformed with HC fragment 1204–1522 (in pGBT9) and LCb/LCa (in pGAD424), with or without the indicated mutation. The transformants were spotted onto plates lacking Leu and Trp, with (+) or without (–) His. Transformants expressing interacting constructs grew in the absence of His after 2 days. (B) Sequences of bovine HC 1204–1522 mutants that rescued the binding to the LC mutant 16. AH109 cells harboring LCb mutant 16 (in pGAD424) were co-transformed with mutated PCR products of HC 1204–1522 and gapped bait vector, pGBT9. The transformants were selected for positive interactions. The inserts of the recombinant clones (1.2, 2.4 and 2.5) able to interact with the LC mutant 16 are shown. Mutated residues are in bold. The sequence of mutant 16 is in Figure 3A. (CIn vitro binding assays between recombinant hub fragments, with or without mutation K1415E, and wild-type or mutant LCb. Each purified hub fragment or no protein (–) was exposed to Ni2+ affinity resin and then incubated with lysates of bacteria expressing bovine brain LCb with or without the mutation W127R. Proteins bound to the affinity resin were eluted and analyzed for the presence of LC and hub fragments by immunoblotting with rabbit polyclonal antisera raised against the conserved region of LCs or the proximal region of HC, respectively.
None
Fig. 5. Double mutation of tryptophan to arginine at clathrin light chain LCb residues 105 and 138 abrogates the binding to HC, and the interaction is rescued by HC mutation K1326E. (A) The three-dimensional structure of the central portion of LCb is modeled as an α-helix, viewed from the C-terminus. The predicted orientation of the side chains of tryptophan residues at positions 105, 127 and 138 is shown. (B) Plate growth assay of yeast AH109 cells co-transformed with HC 1204–1522 (in pGBT9) and LCb (in pGAD424), with or without the indicated mutation(s). The transformants were spotted onto plates lacking Leu and Trp, with (+) or without (–) His and Ade. Transformants expressing interacting constructs grew in the absence of His and Ade after 2 days. These results are representative of three independent experiments. (C) Sequences of bovine HC 1204–1522 mutants that rescued binding to the LC mutant W105, 138R. AH109 cells harboring the LCb W105, 138R mutant fragment (in pGAD424) were co-transformed with mutated PCR products of HC 1204–1522 and gapped bait vector, pGBT9. The transformants were selected for positive interactions. The inserts of the recombinant clones (1, 2, 3 and 4) able to interact with LCb W105, 138R mutant fragment are shown. Mutated residues are in bold. (DIn vitro binding assay (as described for Figure 4C) between recombinant hub fragments, with or without mutation K1326E, and wild-type or mutant LCb. LC and hub fragments were detected by immunoblotting with rabbit polyclonal antiserum raised against the conserved region of LCs or mouse monoclonal antibody against the His6 tag epitope, respectively.
None
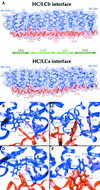
Fig. 6. Model of the contact between clathrin HC and LC. (A) A model of the interface of the minimal HC-binding region of LC (red) with the HC proximal leg (blue) produced by molecular dynamics calculations after alignment according to the mapping data produced in this study. The positions of the LC tryptophan residues involved in HC binding are indicated for the modeled segments of LCb 90–157 and LCa 93–160. Note that the HC modeling extends N-terminally to the major contact region, which begins at around residue 1267, and the extra helices project back from the interface. (B) The hydrophobic pocket of HC K1415 (purple) in contact with LCb W127. HC K1415 is sandwiched between the LC tryptophan and F1410, forming a strong cation–π interaction. (C) Interactions with HC in the region of LCb W105. While LCb W105 does not interact directly with HC K1326 (purple), it packs against the aromatic side chains of F1296 and F1327, which do interact. LCb S101 and LCa S104 are oriented to hydrogen-bond with the HC backbone. (D) The hydrophobic pocket of HC K1415 (purple) in contact with LCa W130, a cation–π interaction similar to that predicted for LCb W127. (E) Interactions with HC in the region of LCa W108. The interactions shown are similar to those predicted for LCb though the model indicates they are not as favorable. As our simulations were carried out with explicit hydrogens, their positions are included in the (B–E) and predicted hydrogen bonds are indicated by dashed lines. Figures were created using the Visual Molecular Dynamics program (Humphrey et al., 1996) and rendered with Raster3D (Merritt and Bacon, 1997).
None
Fig. 7. Model of clathrin LC regulatory domains and their position on the clathrin triskelion. The HC-binding region (red) of the LC orients the Ca2+-binding EF-hand towards the N-terminus of the proximal leg so that it may act as a structural switch to modulate the interaction of the N-terminal regulatory region (orange) of the LC with the HC. The predicted EF-hand is placed at the N-terminal red/orange junction. The C-terminus of the LC, with its calmodulin-binding site (also orange), is localized to the vertex of the triskelion. For neuronal CCVs where the calmodulin-binding site is exposed (Pley et al., 1995), calmodulin (purple) may modulate the preferred angle of the triskelion legs as they extend from the vertex. The model of the hub and distal leg segments was generated to scale based on electron microscopy measurements (Näthke et al., 1992), and the LC positioning is to scale based on the structural predictions discussed. TD and calmodulin are not drawn to scale.

References

    1. Acton S. and Brodsky,F.M. (1990) Predominance of clathrin light chain LCb correlates with the presence of a regulated secretory pathway. J. Cell Biol., 111, 1419–1426. - PMC - PubMed
    1. Bogan A.A. and Thorn,K.S. (1998) Anatomy of hot spots in protein interfaces. J. Mol. Biol., 280, 1–9. - PubMed
    1. Brodsky F.M., Galloway,C.J., Blank,G.S., Jackson,A.P., Seow,H.-F., Drickamer,K. and Parham,P. (1987) Localization of clathrin light-chain sequences mediating heavy-chain binding and coated vesicle diversity. Nature, 326, 203–205. - PubMed
    1. Brodsky F.M., Hill,B.L., Acton,S.L., Näthke,I., Wong,D.H., Ponnambalam,S. and Parham,P. (1991) Clathrin light chains: arrays of protein motifs that regulate coated vesicle dynamics. Trends Biochem. Sci., 16, 208–213. - PubMed
    1. Brodsky F.M., Chen,C.-Y., Knuehl,C., Towler,M.C. and Wakeham,D.E. (2001) Biological basket weaving: formation and function of clathrin-coated vesicles. Annu. Rev. Cell Dev. Biol., 17, 517–568. - PubMed

Publication types

MeSH terms