Predicting cerebral ischemic infarct volume with diffusion and perfusion MR imaging
- PMID: 12427640
- PMCID: PMC8185825
Predicting cerebral ischemic infarct volume with diffusion and perfusion MR imaging
Abstract
Background and purpose: Diffusion and perfusion MR imaging have proved useful in the assessment of acute stroke. We evaluated the utility of these techniques in detecting acute ischemic infarction and in predicting final infarct size.
Methods: Diffusion and hemodynamic images were obtained in 134 patients within a mean of 12.3 hours of onset of acute ischemic stroke symptoms. We retrospectively reviewed patient radiology reports to determine the presence or absence of lesion identification on initial diffusion- (DW) and perfusion-weighted (PW) images. Radiologists were not blinded to the initial clinical assessment. For determination of sensitivity and specificity, the final discharge diagnosis was used as the criterion standard. Neurologists were not blinded to the DW or PW imaging findings. In 81 patients, acute lesions were compared with final infarct volumes.
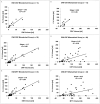
Results: Sensitivities of DW imaging and cerebral blood volume (CBV), cerebral blood flow (CBF), and mean transit time (MTT) perfusion parameters were 94%, 74%, 84%, and 84%, respectively. Specificities of DW imaging, CBV, CBF, and MTT were 96%, 100%, 96%, and 96%, respectively. Results were similar in 93 patients imaged within 12 hours. In 81 patients with follow-up, regression analysis yielded r(2) = 0.9, slope = 1.24 for DW imaging; r(2) = 0.84, slope = 1.22 for CBV; r(2) = 0.35, slope = 0.44 for CBF; and r(2) = 0.22, slope = 0.32 for MTT, versus follow-up volume. A DW-CBV mismatch predicted additional lesion growth, whereas DW-CBF and DW-MTT mismatches did not. Results were similar in 60 patients imaged within 12 hours.
Conclusion: Diffusion and hemodynamic images are sensitive and specific for detecting acute infarction. DW imaging and CBV best predict final infarct volume. DW-CBV mismatch predicts lesion growth into the CBV abnormality. CBF and MTT help identify additional tissue with altered perfusion but have lower correlation with final volume.
Figures


References
-
- Kucharczyk J, Vexler ZS, Roberts TP, et al. Echo-planar perfusion-sensitive MR imaging of acute cerebral ischemia. Radiology 1993;188:711–717 - PubMed
-
- Kucharczyk J, Mintorovich J, Asgari H, Moseley M. Diffusion/perfusion MR imaging of acute cerebral ischemia. Magn Reson Med 1991;19:311–315 - PubMed
-
- Moseley M, Cohen Y, Mintorovich J, et al. Early detection of regional cerebral ischemia in cats: comparison of diffusion- and T2-weighted MRI and spectroscopy. Magn Reson Med 1990;14:330–346 - PubMed
-
- Mintorovich J, Moseley M, Chileuitt L, Shimizu H, Cohen Y, Weinstein P. Comparison of diffusion- and T2-weighted MRI for the early detection of cerebral ischemia and reperfusion in rats. Magn Reson Med 1991;18:39–50 - PubMed
Publication types
MeSH terms
LinkOut - more resources
Full Text Sources
Other Literature Sources
