. 2002 Nov 15;22(22):9961-71.
doi: 10.1523/JNEUROSCI.22-22-09961.2002.

Firing properties of identified interneuron populations in the mammalian hindlimb central pattern generator

Affiliations

Firing properties of identified interneuron populations in the mammalian hindlimb central pattern generator

Simon J B Butt et al. J Neurosci. .

Abstract

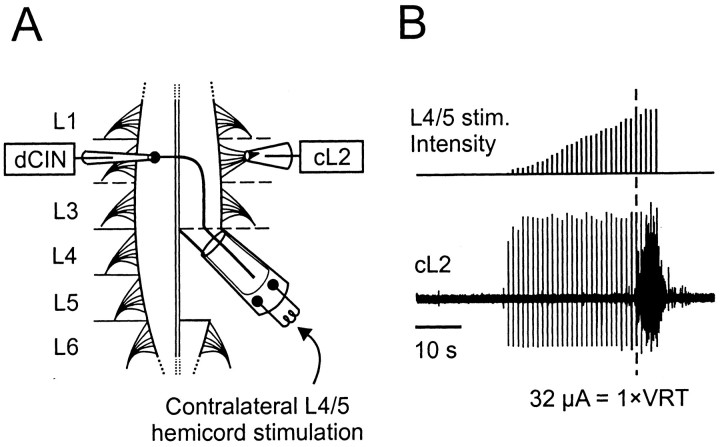
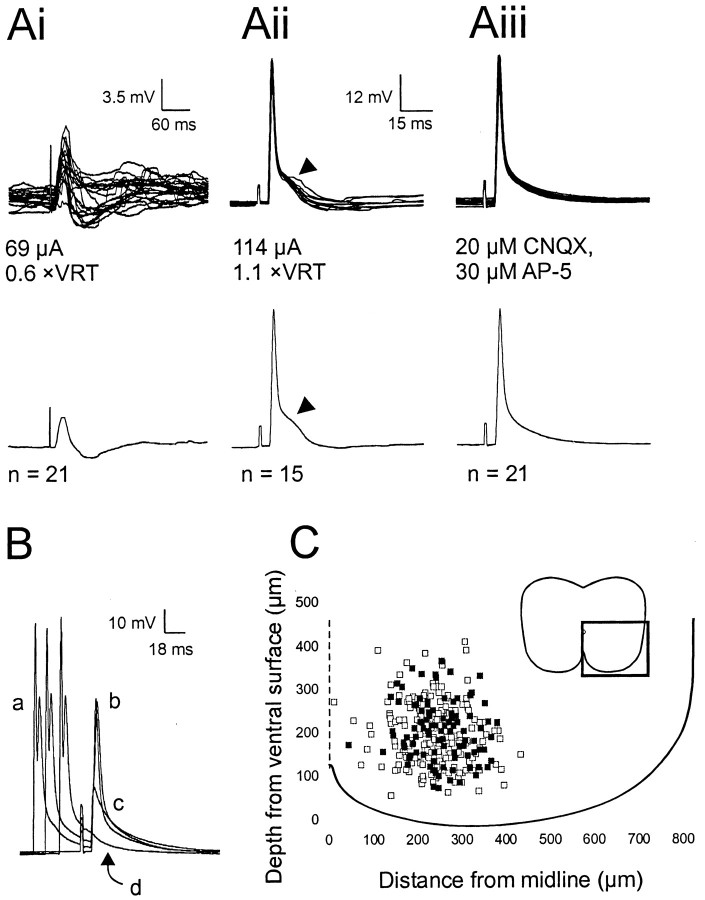
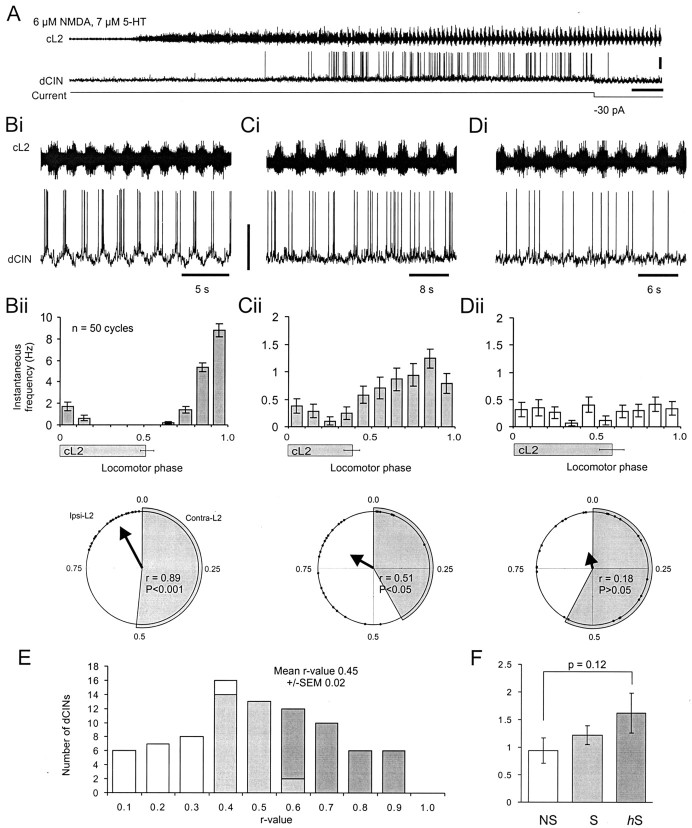
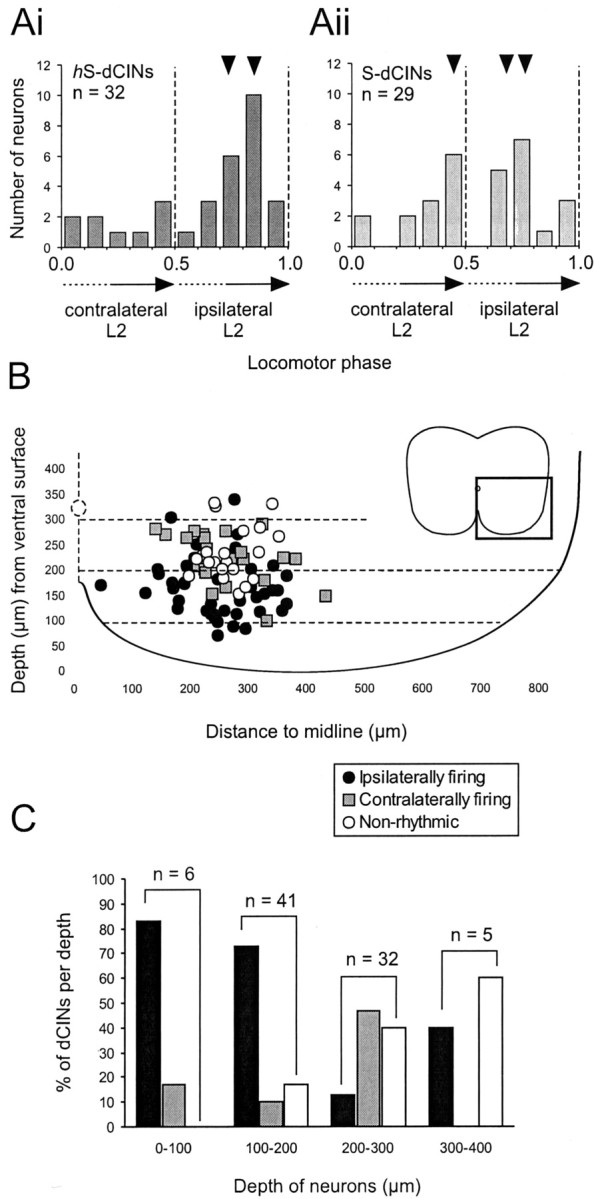
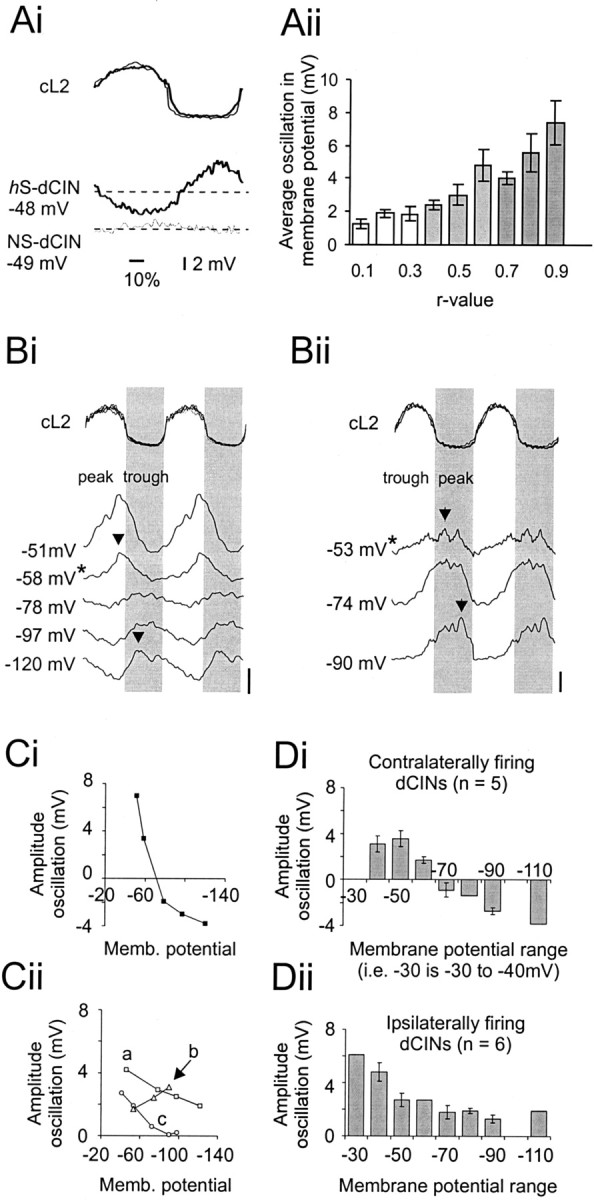
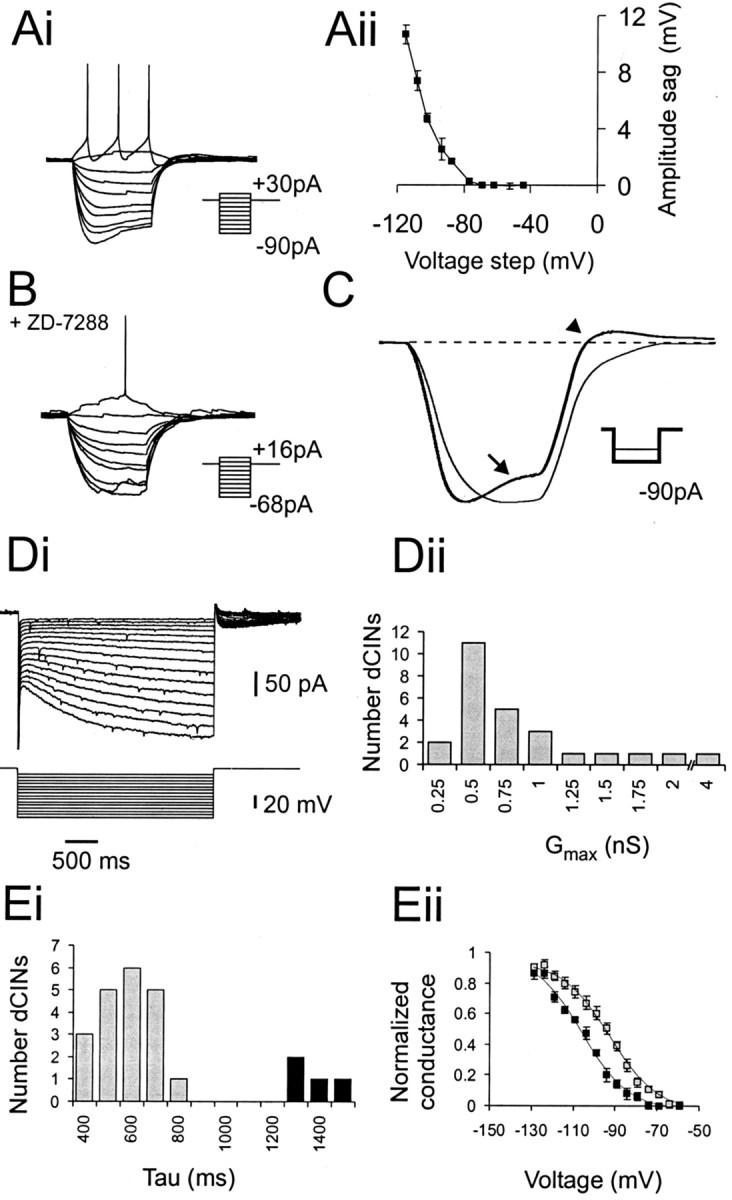
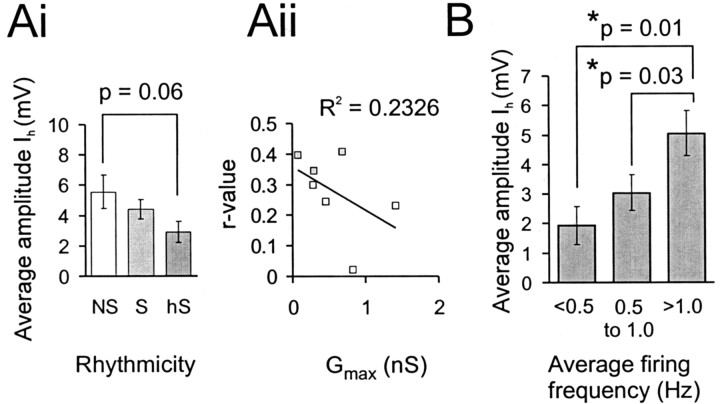
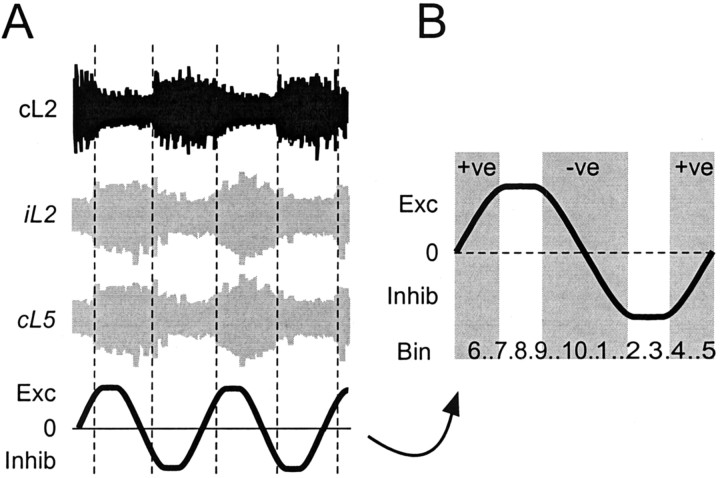
Little is known about the network structure of the central pattern generator (CPG) controlling locomotor movements in mammals. The present experiments aim at providing such knowledge by focusing on commissural interneurons (CINs) involved in left-right coordination. During NMDA and 5-HT-initiated locomotor-like activity, we recorded intracellularly from caudally or descending projecting L2 and L3 CINs (dCINs) located in the ventromedial area of the lumbar spinal cord in newborn rats. This region is crucial for rhythmic motor output and left-right coordination. The overall sample of dCINs represented a heterogenous population with neurons that fired in all phases of the locomotor cycle and exhibited varying degrees of rhythmicity, from strongly rhythmic to nonrhythmic. Among the rhythmic, putative CPG dCINs were populations that fired in-phase with the ipsilateral or with the contralateral L2 locomotor-like activity. There was a high degree of organization in the dorsoventral location of rhythmic dCINs, with neurons in-phase with the ipsilateral L2 activity located more ventrally. Spikes of rhythmically active dCINs were superimposed on membrane oscillations that were generated predominantly by synaptic input, with little direct contribution from the intrinsic pacemaker hyperpolarization-activated inward current. For both ipsilaterally and contralaterally firing dCINs the dominant synaptic drive was in-phase with the ipsilateral L2 motor activity. This study provides the first characterization of putative CPG interneurons in the mammalian spinal cord. Our results suggest an anatomical and physiological separation of CPG commissural interneurons in the ventral horn and demonstrate that it is possible to target specific interneuron subpopulations in the mammalian locomotor network.


Figures

Fig. 1.
Fig. 1.
Experimental setup. A, Schematic of the lumbar region of the neonatal rat spinal cord and the setup used to investigate the locomotor properties of dCINs. Suction electrodes were placed on the contralateral L4–L5 hemicord for electrical stimulation of caudally projecting axons, and on the cL2 to record ventral root activity. The patch electrode (dCIN) was lowered into a slit made in the ventral surface of L2–L3. B, The intensity of L4–L5 stimulation was increased manually (top trace). At higher levels, the stimulation (stim.) caused sustained activity in the cL2 ventral root (lower trace). The threshold for such activity, as indicated by the dashed line, was termed the VRT.
Fig. 2.
Fig. 2.
Identification of dCINs in the lumbar region by the presence of an antidromic action potential.Ai–Aiii, The top traces show the raw data superimposed, and the bottom traces show the averaged trace. Ai, EPSP–IPSP evoked at low stimulus levels (<1 × VRT) in a neuron subsequently identified as a dCIN by the presence of an antidromic spike (Aii,Aiii). Antidromic spikes were elicited at a short, constant latency (Aii). The hump in the spike, as indicated by the arrowheads in Aii, is the subthreshold EPSP that was abolished on incubation with 20 μm AP-5 and 30 μm CNQX (Aiii). B, Collision test to verify the antidromic nature of the spike. a, Orthodromic spike elicited by a 2 msec suprathreshold depolarizing current pulse;b, antidromic spike; c, initial segment spikelet; d, complete abolition of the antidromic action potential. C, Location of neurons recorded from in the ventromedial area (as indicated by the box,inset) of L2–L3. Black squares, Caudally projecting dCINs; white squares, non-dCINs.
Fig. 3.
Fig. 3.
Most dCINs are rhythmic during NMDA- and 5-HT-induced locomotor-like activity. A, Application of NMDA and 5-HT to the isolated spinal cord resulted in rhythmic locomotor-like activity in the cL2 (top trace) and a depolarization and rhythmic firing observed in the dCIN (bottom trace). Calibration: 20 mV, 24 sec. B–D, Analysis of the activity of the three types of dCIN during locomotor-like activity. Highly rhythmic hS-dCINs (B) were characterized first, on the basis that they exhibited pronounced oscillations in membrane potential (bottom trace, Bi; calibration, 40 mV) during locomotor activity (top trace,Bi). Second, their spikes were also locked to a specific phase as revealed by the spike frequency histogram of 50 locomotor cycles (Bii, top trace). Third, the circular plot vector for 25 spikes as shown by the bold arrow in the bottom trace of Biiwas highly significant (p < 0.001). The duration of cL2 bursting is indicated in Bii–Dii by thegray bars (±SD; n = 50) under thehistogram and the gray segment in thecircular plot. C, Rhythmic S-dCIN that preferentially fires out-of-phase with cL2 activity.p values for S-dCINs were in the range of 0.001 <p < 0.05 (Cii, bottom trace). D, Nonrhythmic NS-dCIN with spikes not locked to any particular phase of the locomotor cycle and withp > 0.05 (Dii, bottom trace). In all subsequent plots, hS-dCIN data are shown in dark gray; S-dCIN data are light gray; and NS-dCIN data are white.E, Distribution of dCIN r values (n = 84). F, Analysis of the instantaneous firing frequency exhibited by the three classes of dCIN.
Fig. 4.
Fig. 4.
Rhythmic dCIN populations with distinct ventral-dorsal locations exhibit differing phase relationships.A, Plot of dCIN circular statistic vectors over a locomotor cycle showing the distribution preferred phases of firing in rhythmic dCINs (hS-dCINs, Ai; S-dCINs,Aii). The small black arrowheads above the histograms indicate the bins containing most dCINs for each group. The dashed lines indicate the approximate transition points from contralateral bursts (cL2) to ipsilateral burst (iL2) (0.5) and from iL2 to cL2 (1.0).B, distribution of contralaterally firing (gray squares), ipsilaterally firing (black circles), and nonrhythmic (white circles) dCINs in the transverse plane of the lumbar spinal cord (the area magnified as shown in the inset).C, Histogram of the percentage of each cell type at a given depth (color coding as for B).Numbers shown above the bar graphsindicate the size of the sample at each depth. Memb., Membrane.
Fig. 5.
Fig. 5.
Locomotor-related membrane oscillations of dCINs reflect synaptic input. Ai, Averaged membrane oscillation of an hS-dCIN (bold line,bottom traces) and NS-dCIN (thin line,bottom traces) with respect to the normalized and rectified cL2 cycle (top panel).Aii, Relationship between r value and average membrane oscillation (at 0 bias for a minimum of 20 cL2 cycles;n = 77). B, Membrane oscillations at different holding potentials for two different dCINs (Bi,Bii). Top traces show the normalized cL2 cycle, with the gray areacorresponding to the ipsilateral L2 phase. Lower tracesshow the averaged, 10 Hz filtered intracellular recordings for 2 dCINs. Zero bias is indicated by the asterisk next to the membrane potential. The peak is indicated by the arrows.Bi, Neuron in which the phase of the peak reverses when hyperpolarized beyond the reversal potential for Cl. Bii, Cell with increased oscillation amplitudes at more hyperpolarized levels.Ci, Plot (black squares) of relative amplitude of the peak–trough oscillation at varying membrane potentials for the example shown in Bi. Note the sign reversal when the cell is hyperpolarized. Cii, Example of three dCINs driven predominantly by excitation: a, mixed AMPA and NMDA components (squares);b, mainly AMPA-driven (triangles); c,mainly NMDA-driven (circles). D, Distribution of average membrane oscillation for different membrane potential (in bins of 10 mV) ranges in neurons that are driven predominantly by inhibition and firing in-phase with the contralateral root (Di) and dCINs that receive phasic excitatory input and are firing in-phase with the ipsilateral root (Dii).
Fig. 6.
Fig. 6.
Characteristics of the dCINIh. A, Intracellular recording from S-dCINs showing a voltage sag (Ai) in response to current injection and a depolarizing rebound after termination of the current pulse. Data of the averageIh-induced sag amplitude ± SE from three control I–V trials are shown inAii. B, Effect of 20 min incubation with 50 μm ZD 7288. Note the decrease in size of the injected current steps. C, Effect of ZD 7288 shown by comparison of averaged data for three runs at the most hyperpolarized step (control, bold line; ZD 7288,thin line). The control sag is indicated by thearrow, and the rebound depolarization is indicated by the arrowhead. Di, Activation ofIh measured under voltage-clamp conditions. Five millivolt steps were applied between −60 and −130 mV from a holding potential of −50 mV. Dii, Distribution of Gmax (maximal conductance) for 24 dCINs.Ei, Analysis of τ Act revealed two discrete populations in the sample: short τ Act(gray) and longer (black) τAct dCINs. The plot shows voltage versus normalized conductance for the both populations of τAct, same color code as forEi. Note that the dCINs with longer τActhave their activation curves shifted to a more hyperpolarized level than those with short τAct.
Fig. 7.
Fig. 7.
Amplitude of Ih is not related to rhythmicity but to firing frequency. Ai, Plot of the average Ih-induced sag amplitude for the three different classes of dCIN as measured under current-clamp conditions (hyperpolarizing step to −110 mV). Aii, Scatterplot showing the insignificant relationship between Gmax and rhythmicity (r) in seven neurons recorded under voltage-clamp conditions. B, Distribution of the Ih-induced sag amplitude measured under current-clamp conditions for different ranges of firing frequencies in rhythmic dCINs.
Fig. 8.
Fig. 8.
Hypothetical model for the role of rhythmic dCINs during locomotor-like activity. A, The phase relationship of dCINs can be related to not only the recorded cL2 activity (black trace) but also to the likely activity of the ipsilateral motor pool (iL2; top gray trace) and target MNs (cL5; bottom gray trace). The expected role of the L2–L5 dCINs is shown in thebottom trace and expanded in B.Exc, Phase of predominantly crossed iL2 to cL5 excitatory information; Inhib, phase of mainly inhibitory information. The gradient of the line, positive (+ve), negative (−ve), or 0, reflects the prevalent drive provided by CINs. Numbers at thebottom reflect the bins for the average firing frequency histograms such as those in Figure 3Bii–Dii.

References

    1. Andersen P, Moser EI. Brain temperature and hippocampal function. Hippocampus. 1995;5:491–498. - PubMed
    1. Beierholm U, Nielsen CD, Ryge J, Alstrom P, Kiehn O. Characterization of reliability of spike timing in spinal interneurons during oscillating inputs. J Neurophysiol. 2001;86:1858–1868. - PubMed
    1. Berkowitz A, Stein PSG. Activity of descending propriospinal axons in the turtle hindlimb enlargement during two forms of fictive scratching: phase analyses. J Neurosci. 1994;14:5105–5119. - PMC - PubMed
    1. Buchanan JT. Identification of interneurons with contralateral, caudal axons in the lamprey spinal cord: synaptic interactions and morphology. J Neurophysiol. 1982;47:961–975. - PubMed
    1. Buchanan JT. Lamprey spinal interneurons and their roles in swimming activity. Brain Behav Evol. 1996;48:287–296. - PubMed

Publication types

MeSH terms

LinkOut - more resources