. 2002 Nov 15;22(22):10053-65.
doi: 10.1523/JNEUROSCI.22-22-10053.2002.

A synaptic explanation of suppression in visual cortex

Affiliations

A synaptic explanation of suppression in visual cortex

Matteo Carandini et al. J Neurosci. .

Abstract

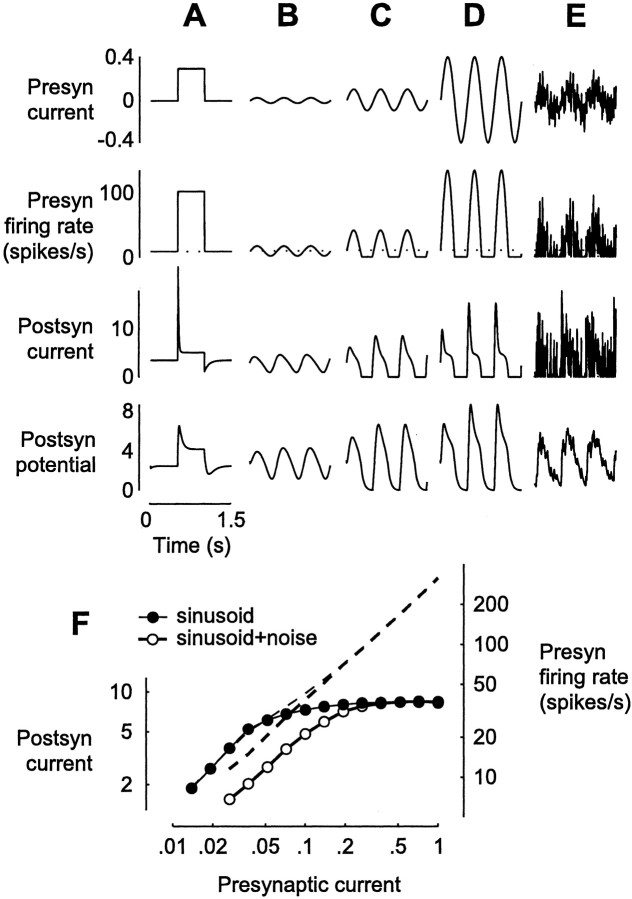
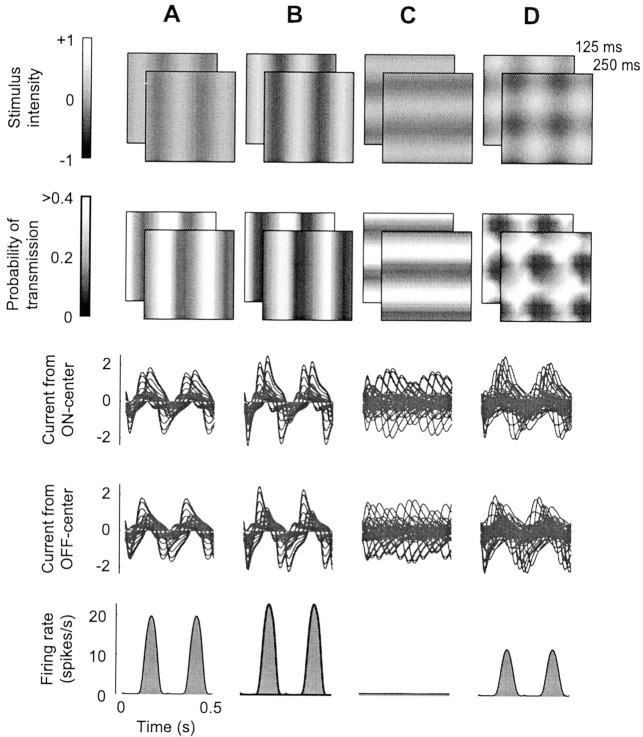
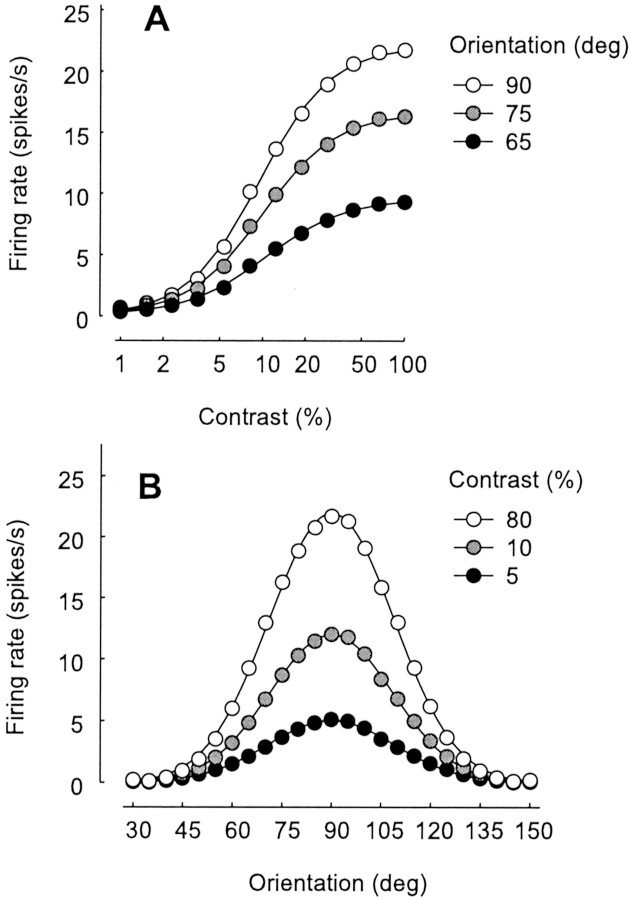
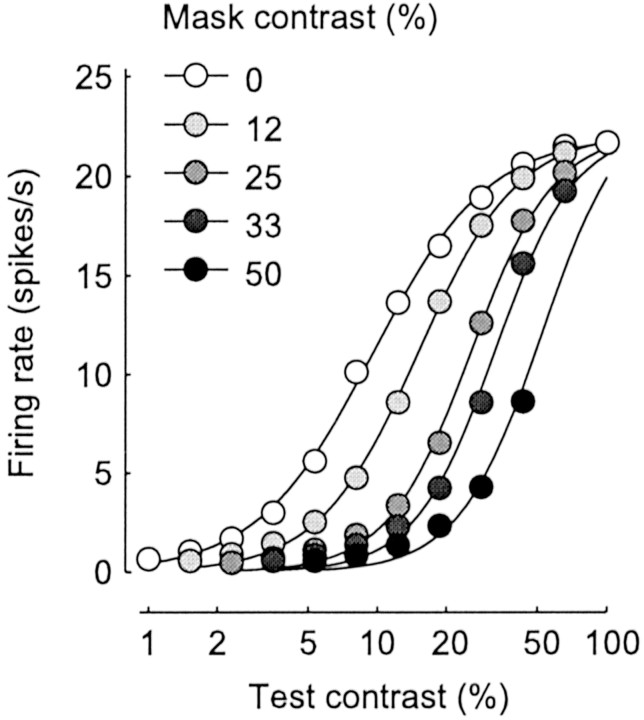
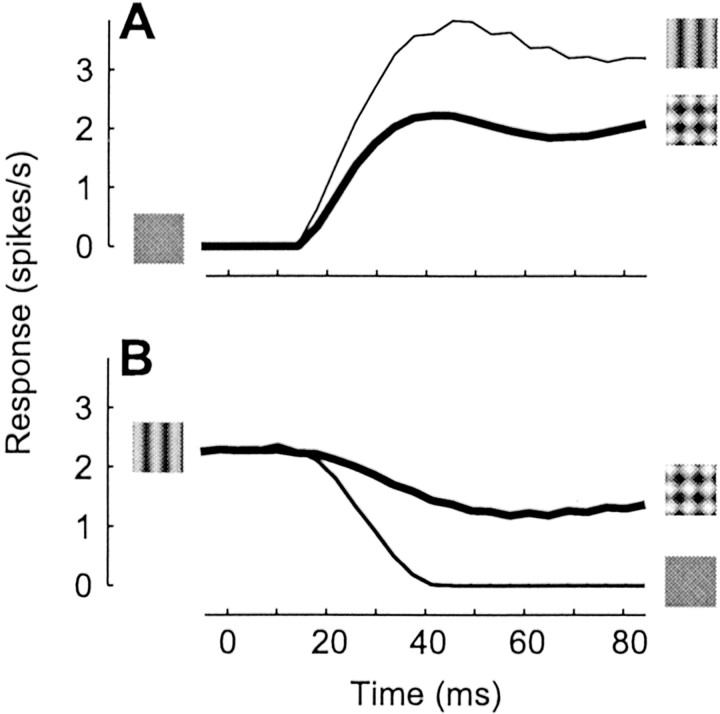
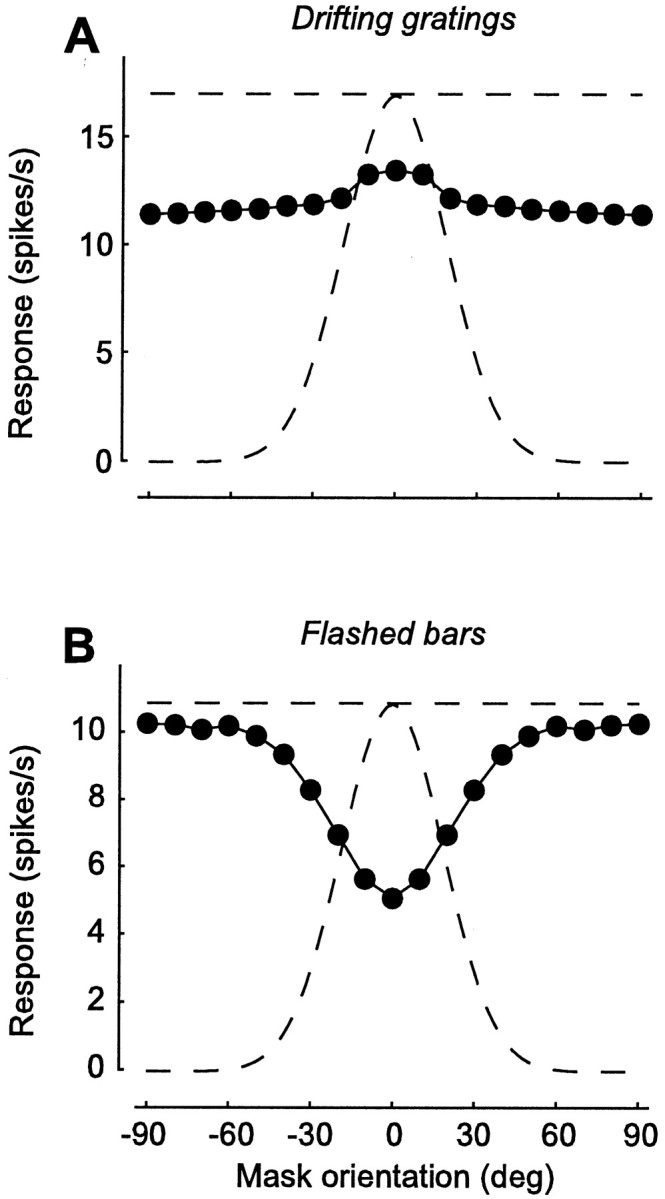
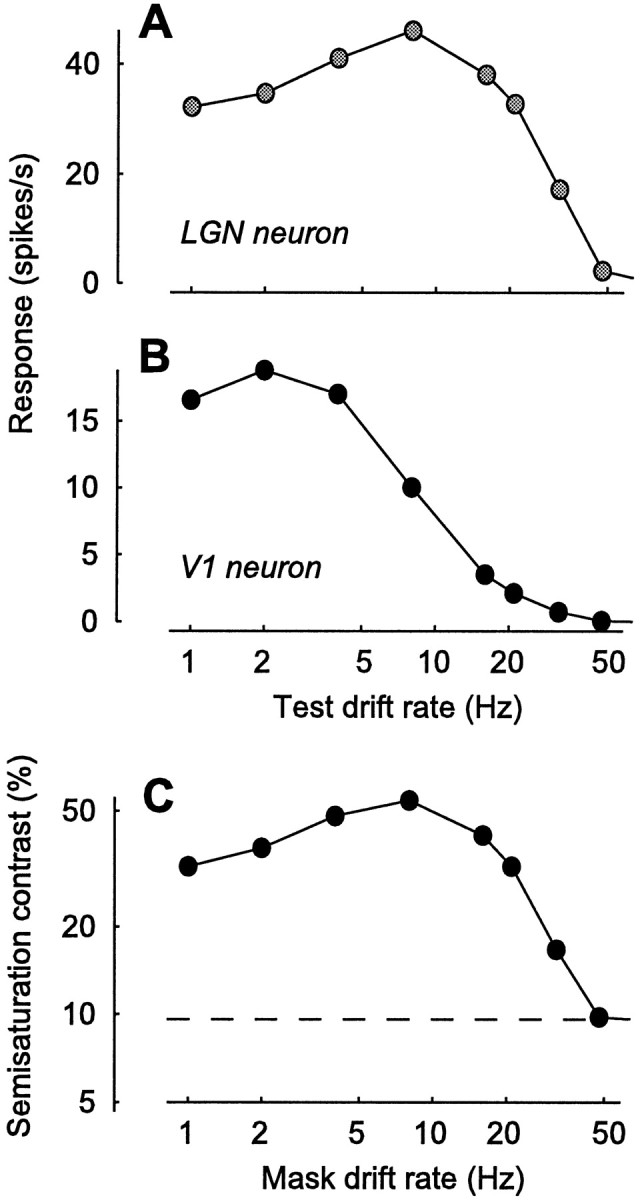
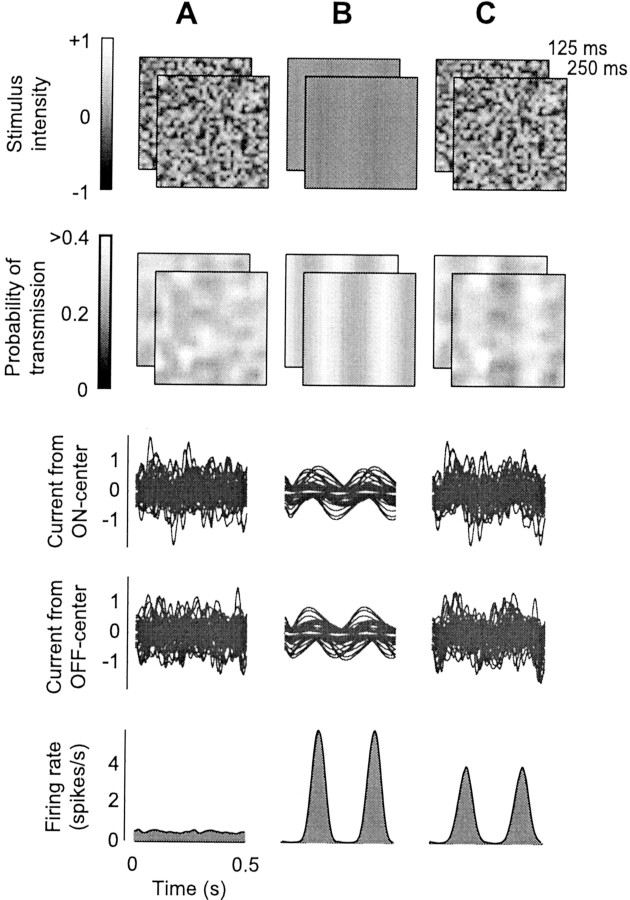
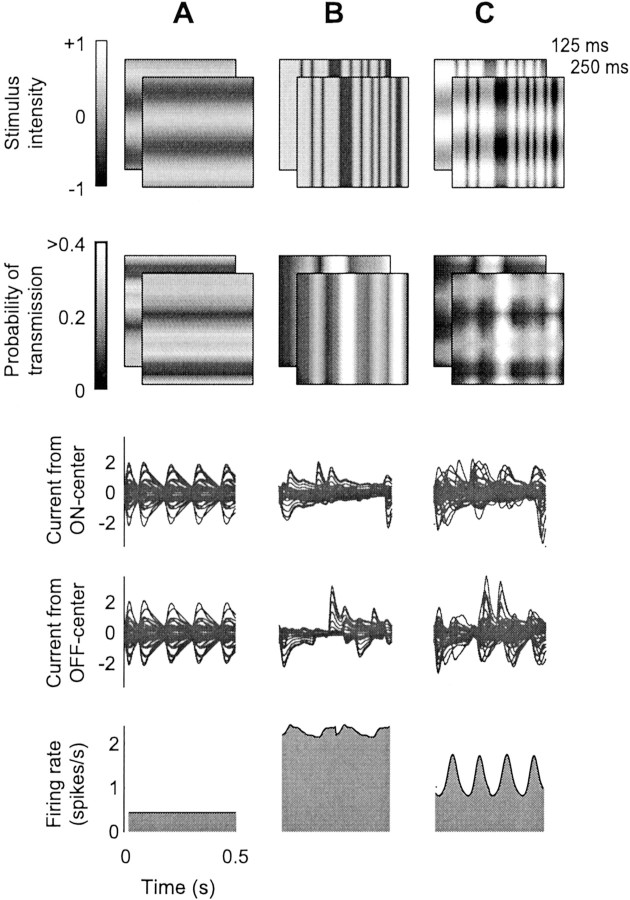
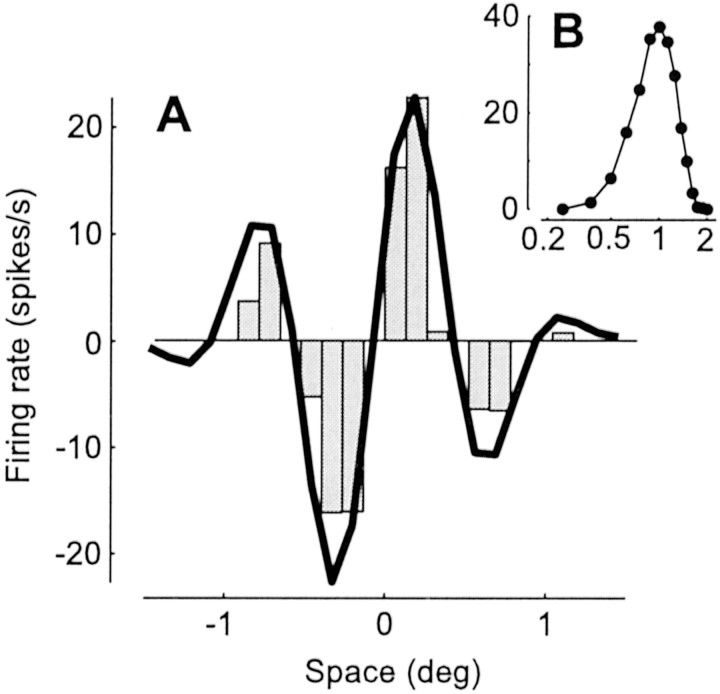
The responses of neurons in the primary visual cortex (V1) are suppressed by mask stimuli that do not elicit responses if presented alone. This suppression is widely believed to be mediated by intracortical inhibition. As an alternative, we propose that it can be explained by thalamocortical synaptic depression. This explanation correctly predicts that suppression is monocular, immune to cortical adaptation, and occurs for mask stimuli that elicit responses in the thalamus but not in the cortex. Depression also explains other phenomena previously ascribed to intracortical inhibition. It explains why responses saturate at high stimulus contrast, whereas selectivity for orientation and spatial frequency is invariant with contrast. It explains why transient responses to flashed stimuli are nonlinear, whereas spatial summation is primarily linear. These results suggest that the very first synapses into the cortex, and not the cortical network, may account for important response properties of V1 neurons.


Figures

Fig. 1.
Fig. 1.
Input–output properties of a depressing synapse.A–E, Effects of injection of various waveforms into the presynaptic (Presyn) neuron. Top row, Injected current Ipre (A, step; B–D, 2 Hz sinusoids with amplitudes 0.025, 0.1, and 0.4; E, sinusoid with amplitude 0.1 plus white noise with amplitude 0.25). Second row, The resulting presynaptic firing rate f. Third row, The output of the depressing synapse; postsynaptic (Postsyn) current Ipost = p u f.Bottom row, Postsynaptic potential V, which is Ipost after filtering by the passive properties of the neuron. To avoid unnecessary free parameters, we have used the same units, spikes per second, for currents, potentials, and firing rates. F, The 2 Hz component of presynaptic firing rate f (right axis,dashed lines) and of postsynaptic currentIpost (left axis,symbols) as a function of the amplitude of presynaptic sinusoidal current Ipre.
Fig. 2.
Fig. 2.
Responses to gratings and plaids.A, Vertical grating at 25% contrast drifting to the left at 4 Hz. Top row, Two stimulus frames, att = 125 and 250 msec. Second row, Corresponding spatial maps of synaptic depression, with intensity proportional to probability of transmission for synapses from LGN ON-center neurons. Third row, Postsynaptic currents in the V1 neuron, from ON-center LGN neurons, for the first two stimulus cycles. Fourth row, Same for OFF-center LGN inputs.Bottom row, Average firing rate responses to two stimulus cycles. B, Same grating as in A, at 50% contrast. Saturation is evident; firing rates are less than twice those in A. C, Same grating as inA but oriented horizontal and drifting upward.D, Plaid obtained by summing the gratings fromA and C. Suppression is visible because firing rates are less than those in A.
Fig. 3.
Fig. 3.
Dependence of response on grating contrast and orientation. A, Response versus stimulus contrast for three stimulus orientations. Curves fitted to data are hyperbolic ratios (Albrecht and Hamilton, 1982) and are vertically scaled versions of each other. B, Response versus stimulus orientation for three stimulus contrasts. Curves fitted to data are Gaussians and are vertically scaled versions of each other. Stimuli were drifting sinusoidal gratings as in Figure 2A–C. Firing rates are first harmonic amplitudes, the component of the responses at the stimulus temporal frequency, obtained by fitting responses with sinusoids.
Fig. 4.
Fig. 4.
Cross-orientation suppression. Responses for plaids composed of an optimally oriented test grating and an orthogonal mask grating (as in Fig. 2D). Gray levels correspond to different mask contrasts. Curves are hyperbolic ratios (Albrecht and Hamilton, 1982) fitted to each set of data points independently. The curves shift rightward (and become slightly steeper) with increasing mask contrast.
Fig. 5.
Fig. 5.
Time course of cross-orientation suppression; simulation of an experiment similar to that of Smith et al. (2001). Stimuli were a blank screen, a test grating with optimal orientation, and the plaid obtained by summing the test and an orthogonal mask grating (for each grating, spatial frequency = 1 cycle/°, drift rate = 5 Hz, contrast = 20%). A, Response to test and to plaid, starting from blank. B, Response to plaid and to blank, starting from test. Responses are mean firing rates, averaged for 12 spatial phases of test grating; for each phase, responses resembled the rectified sinusoid in Figure2A.
Fig. 6.
Fig. 6.
Orientation dependence of suppression by drifting and flashed masks. Responses to an optimally oriented test as a function of mask orientation. For comparison, the curved dashed line shows responses to tests of different orientations, in the absence of a mask. The straight dashed line is the response to optimal orientation. A, Suppression by superimposed drifting gratings. This is a simulation of an experiment by Bonds (1989). Responses are computed by fitting to the firing rate a sinusoid with the temporal frequency of the test grating (4 Hz). Gratings (20% contrast) were presented for 1 sec. Mask grating drifted at 3 Hz and was superimposed to the test. B, Suppression by a mask flashed bar preceding a test flashed bar. This is a simulation of an experiment by Nelson (1991a). Responses are computed by taking the mean firing rate during presentation of a test bar. Bars had maximal intensity on a mean gray background and were flashed for 100 msec; mask preceded test by 50 msec.
Fig. 7.
Fig. 7.
Suppression by masks drifting at different rates. This is a simulation of an experiment by Freeman et al. (2002).A, B, Selectivity for drift rate in our model LGN neurons (A) and in our model V1 neuron (B), measured with drifting gratings.C, Dependence of semisaturation contrast on mask drift rate. The semisaturation contrast, the test contrast needed to reach half the maximal response, is a measure of strength of suppression.Dashed line, Semisaturation contrast for test grating presented alone. In the presence of a mask grating, the semisaturation is larger, corresponding to a rightward shift of the curves in Figure4.
Fig. 8.
Fig. 8.
Suppression with dynamic noise (same format as Fig. 2). A, White noise stimulus. B, Grating with 10% contrast, drifting at 4 Hz with optimal orientation and spatial frequency for the model V1 neuron. C, Superposition of white noise and drifting grating. Although it elicits minimal responses in the V1 neuron, the white noise stimulus is a powerful mask.
Fig. 9.
Fig. 9.
Suppression from a contrast-reversing mask grating (same format as Fig. 2), simulating the experiment of Morrone et al. (1982). A, Mask stimulus, a contrast-reversing (4 Hz) grating with orientation orthogonal to that preferred by the model V1 neuron. B, Test stimulus, a drifting one-dimensional noise pattern with optimal orientation and speed for the model V1 neuron. C, Superposition of test and mask.
Fig. 10.
Fig. 10.
Linearity of spatial summation; simulation of the experiment by Movshon et al. (1978a). A, One-dimensional receptive field profile of the model neuron. The histogram shows responses to a stationary full-contrast vertical bar (width, 0.25°; duration, 100 msec); positive (negative) values are responses to a bright (dark) bar, as a function of bar position. A curve indicates a prediction of receptive field profile based on responses to drifting gratings under the assumption of linearity.B, Spatial frequency selectivity of the neuron measured with 4 Hz drifting gratings. The abscissa indicates spatial frequency in cycles per degree, and the ordinate indicates mean firing rate in spikes per second. The curve in Awas derived from these data and arbitrarily rescaled, as by Movshon et al. (1978a).

Similar articles

Cited by

References

    1. Abbott LF, Varela JA, Sen K, Nelson SB. Synaptic depression and cortical gain control. Science. 1997;275:220–224. - PubMed
    1. Albrecht DG. Visual cortex neurons in monkey and cat: effect of contrast on the spatial and temporal phase transfer functions. Vis Neurosci. 1995;12:1191–1210. - PubMed
    1. Albrecht DG, Geisler WS. Motion sensitivity and the contrast-response function of simple cells in the visual cortex. Vis Neurosci. 1991;7:531–546. - PubMed
    1. Albrecht DG, Hamilton DB. Striate cortex of monkey and cat: contrast response function. J Neurophysiol. 1982;48:217–237. - PubMed
    1. Albrecht DG, Farrar SB, Hamilton DB. Spatial contrast adaptation characteristics of neurones recorded in the cat's visual cortex. J Physiol (Lond) 1984;347:713–739. - PMC - PubMed

Publication types