. 2002 Nov;130(3):1319-34.
doi: 10.1104/pp.011254.

Microarray analysis of brassinosteroid-regulated genes in Arabidopsis

Affiliations

Microarray analysis of brassinosteroid-regulated genes in Arabidopsis

Hideki Goda et al. Plant Physiol. 2002 Nov.

Abstract

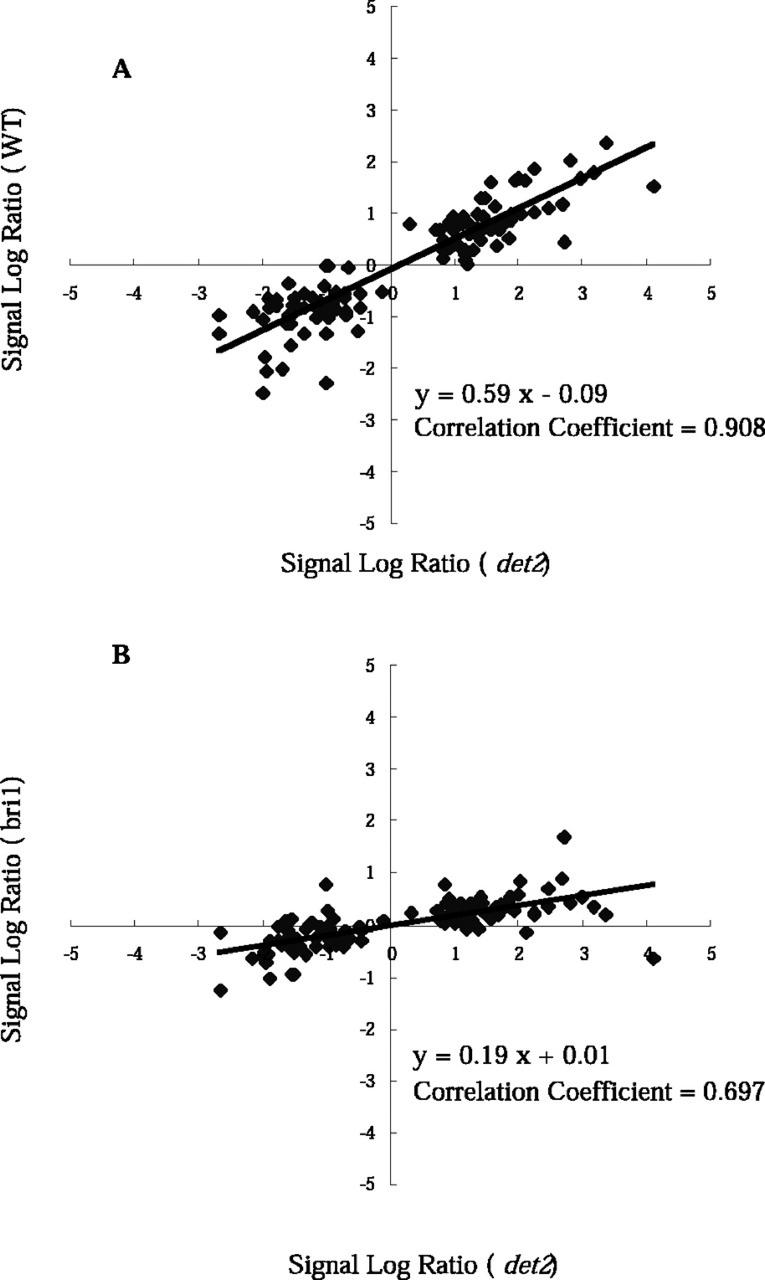
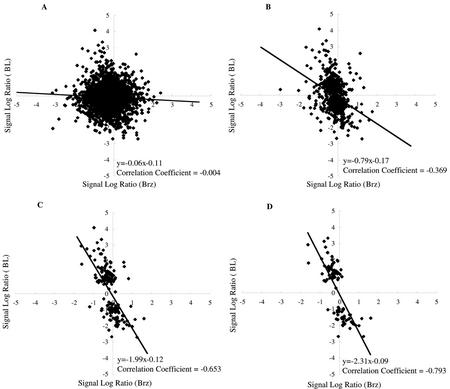
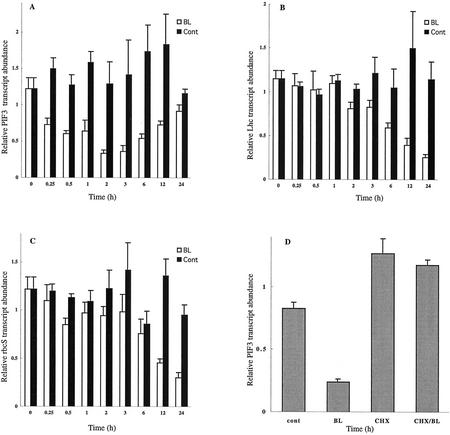
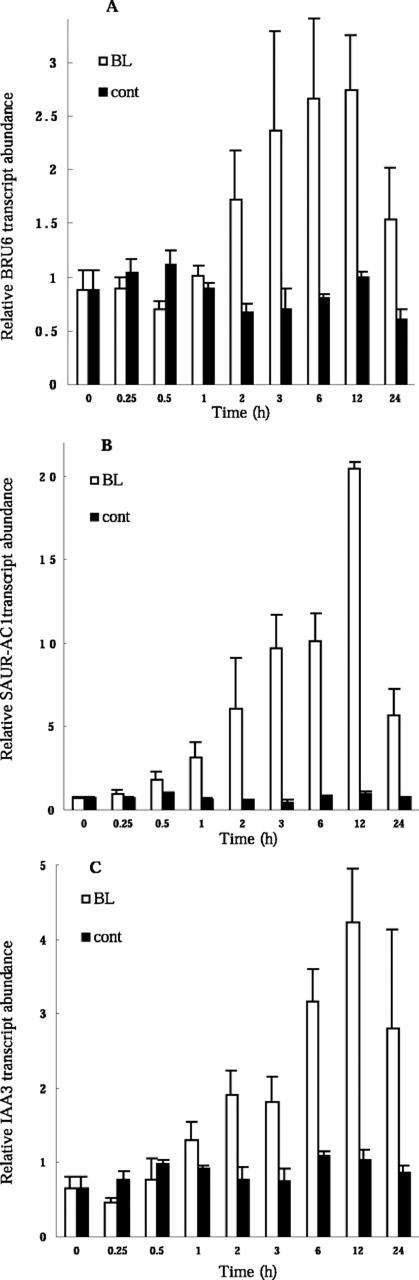
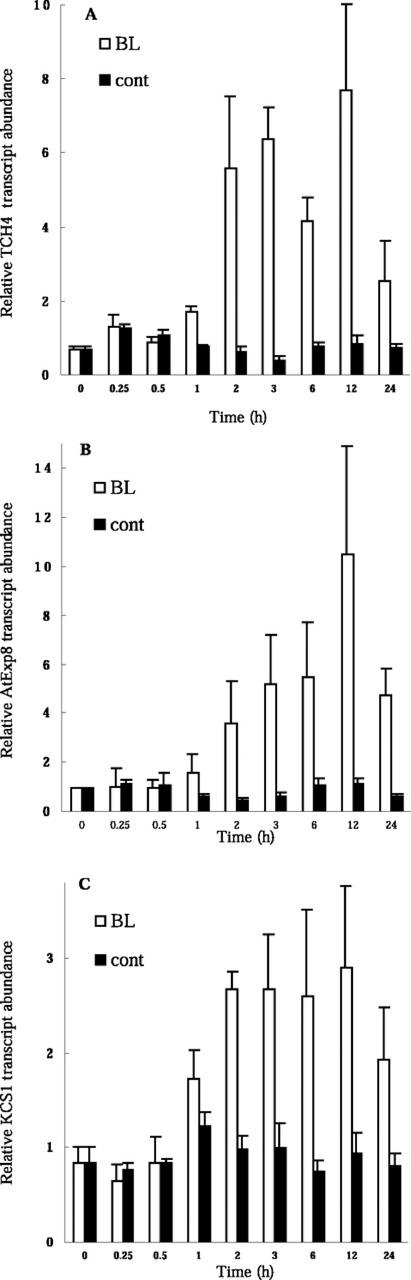
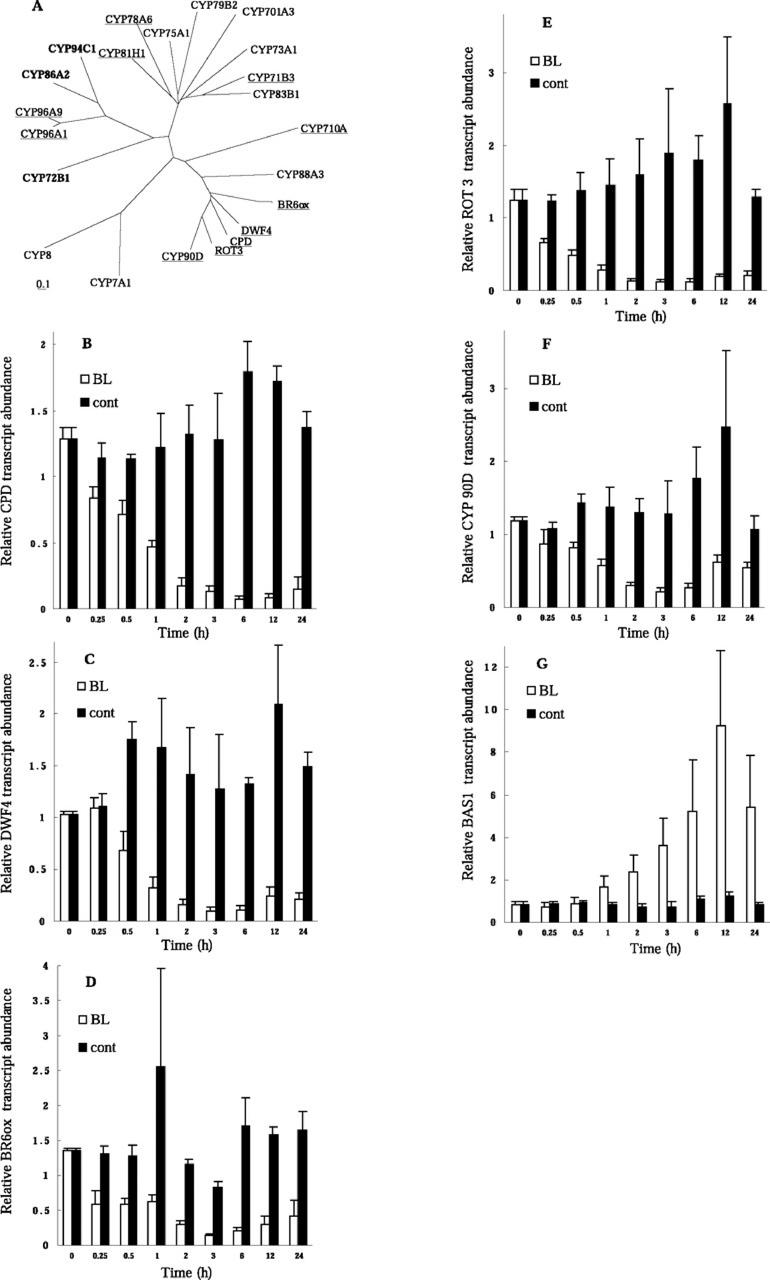
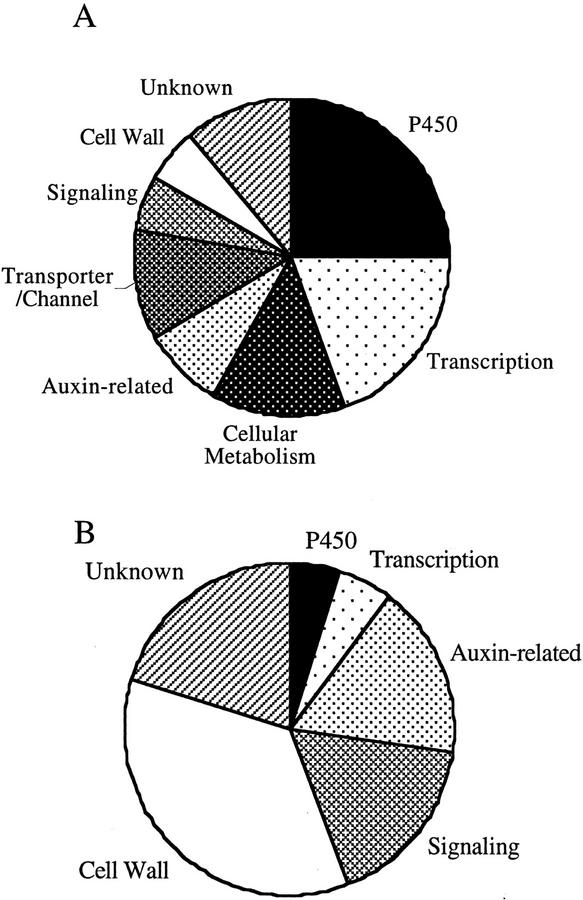
Brassinosteroids (BRs) are steroidal plant hormones that are essential for growth and development. Although insights into the functions of BRs have been provided by recent studies of biosynthesis and sensitivity mutants, the mode of action of BRs is poorly understood. With the use of DNA microarray analysis, we identified BR-regulated genes in the wild type (WT; Columbia) of Arabidopsis and in the BR-deficient mutant, det2. BR-regulated genes generally responded more potently in the det2 mutant than in the WT, and they showed only limited response in a BR-insensitive mutant, bri1. A small group of genes showed stronger responses in the WT than in the det2. Exposure of plants to brassinolide and brassinazole, which is a specific inhibitor of BR biosynthesis, elicited opposite effects on gene expression of the identified genes. The list of BR-regulated genes is constituted of transcription factor genes including the phytochrome-interacting factor 3, auxin-related genes, P450 genes, and genes implicated in cell elongation and cell wall organization. The results presented here provide comprehensive view of the physiological functions of BRs using BR-regulated genes as molecular markers. The list of BR-regulated genes will be useful in the characterization of new mutants and new growth-regulating compounds that are associated with BR function.


Figures

Figure 1
Figure 1
Comparison of BL treatment on the WT, bri1, and det2 seedlings with the use of GeneChip. A, The distribution of the signal log ratio values for WT (y axis) and det2 (x axis) are shown for the BR-regulated genes, listed in Tables I to III. B, The distribution of signal log ratio values for bri1 (y axis) and det2 (x axis) are shown for the BR-regulated genes, listed in Tables I to III. The signal log ratio represents the ratio of hybridization signals between BL- and mock-treated samples using a log (base 2) scale. A signal log ratio of 1 represents a gene that shows a 2-fold increase in expression by BL treatment; a signal log ratio of −1 represents a gene that shows a 2-fold reduction by BL treatment.
Figure 2
Figure 2
Comparison of BL and Brz treatment with the use of GeneChip experiment. The distribution of signal log ratio values for treatments with BL (y axis) and Brz (x axis) are shown. A, All of the genes (>8,000) on the GeneChip are plotted. B, Genes that are induced or reduced more than 2-fold in a single GeneChip experiment are plotted. C, Genes that are induced or reduced more than 2-fold in two of the three GeneChip experiments are plotted. D, The BR-regulated genes (induced or reduced more than 2-fold in three GeneChip experiments, listed in Tables I and II) are plotted. The signal log ratio represents the ratios of hybridization signals using a log (base 2) scale. A signal log ratio of 1 represents a gene whose expression is increased 2-fold by treatment with either BL or Brz, and a signal log ratio of −1 represents a gene whose expression is reduced 2-fold by treatment with either BL or Brz.
Figure 3
Figure 3
Regulation of PIF3, Lhcb1.3, and rbcS-1A gene expression by BL. Time courses of the inhibition of PIF3 (A), Lhcb1.3 (B), and rbcS-1A (C) gene expression by BL. Light-grown det2 seedlings were treated with 10 nm BL or were mock treated (cont) for the indicated times, and transcript abundance was analyzed by quantitative Taq-Man RT-PCR. D, Effects of cycloheximide (CHX) on PIF3 expression. Seedlings were treated with 100 μm CHX or mock treatment for 1 h, and then for an additional 3 h with 10 nm BL or mock treatment in the continued presence of CHX. The amount of PIF3 mRNA was determined by quantitative Taq-Man RT-PCR analysis. Transcript abundance levels are presented as relative values that are normalized with respect to the levels of 18S ribosomal RNA. Data are means ± se from three different plant samples.
Figure 4
Figure 4
Induction of early auxin-inducible genes by BL. Kinetics of the induction of a GH3 homolog, BRU6 (A), SAUR-AC1 (B), and IAA3 (C) by BL are shown. Light-grown det2 seedlings were treated with 10 nm BL or were mock treated (cont) for the indicated times, after which transcript abundance was analyzed by Taq-Man RT-PCR. Transcript abundance levels are presented as relative values that are normalized with respect to the levels of 18S ribosomal RNA. Data are means ± se from three different plant samples.
Figure 5
Figure 5
BL induction of genes that are implicated in cell elongation or cell wall organization. Kinetics of induction by BL of TCH4 (A), a putative expansin gene AtExp8 (B), and KCS1 (C) are shown. Light-grown det2 seedlings were treated with 10 nm BL or were mock treated (cont) for the indicated times, after which transcript abundance was analyzed by Taq-Man RT-PCR. Transcript abundance levels are presented as relative values that are normalized with respect to the levels of 18S ribosomal RNA. Data are shown as means ± se from three different plant samples.
Figure 6
Figure 6
Regulation of P450 genes by BL. A, Phylogenetic relationships among BR-regulated and other P450 genes. Proteins whose genes were shown to be up- or down-regulated by BL are indicated in bold and underlined, respectively (Tables I and II). BR6ox (Arabidopsis, CYP85A, AB035868), CPD (Arabidopsis, CYP90A, X87367), ROT3 (Arabidopsis, CYP90C, AB008097), DWF4 (Arabidopsis, CYP90B, AF044216), and CYP90D (Arabidopsis, AB066286) belong to the CYP85 or CYP90 families. CYP72B1 (Arabidopsis, BAS1, AC003105) is a suppressor of the phyB mutant. CYP88A3 (Arabidopsis, AtKAO1, AF318500) and CYP701A3 (Arabidopsis, GA3, AF047720) participate in GA biosynthesis. CYP83B1 (Arabidopsis, D78598) and CYP79B2 (Arabidopsis, AF069495) participate in auxin metabolism. The genes for CYP73A1 (Helianthus sp., cinnamate 4-hydroxylase, Z17369) and CYP75A1 (Petunia sp., flavonoid-3′, 5′-hydroxylase, D14588) were the first P450 genes to be identified functionally in higher plants and belong to the higher plant-specific group A of P450 genes. The accession numbers of the other P450 family members are D30718 (CYP8) and M93133 (CYP7A1). Kinetics of regulation of the CPD (B), DWF4 (C), BR6ox (D), ROT3 (E), CYP90D (F), CYP72, CYP85, CYP90, and BAS1 (G) genes by BL are shown. Light-grown det2 seedlings were treated with 10 nm BL or were mock treated (cont) for the indicated times, after which transcript abundance was analyzed by Taq-Man RT-PCR. Transcript abundance levels are presented as relative values that are normalized with respect to the levels of 18S ribosomal RNA. Data are shown as means ± se from three different plant samples.
Figure 7
Figure 7
Frequencies of up-regulated and down-regulated genes. A, Distribution of BR-down-regulated genes that are listed in Table I. B, Distribution of BR-up-regulated genes that are listed in Table II. The BR-regulated genes are classified into the functional categories based on their established or putative functions.

References

    1. Abel S, Nguyen MD, Theologis A. The PS-IAA4/5-like family of early auxin-inducible mRNAs in Arabidopsis thaliana. J Mol Biol. 1995;251:533–549. - PubMed
    1. Abel S, Theologis A. Early genes and auxin action. Plant Physiol. 1996;111:9–17. - PMC - PubMed
    1. Altschul SF, Gish W, Miller W, Myers EW, Lipman DJ. Basic local alignment search tool. J Mol Biol. 1990;215:403–410. - PubMed
    1. Arabidopsis Genome Initiative. Analysis of the genome sequence of the flowering plant Arabidopsis thaliana. Nature. 2000;408:796–815. - PubMed
    1. Arnon DI. Copper enzymes in isolated chloroplasts: polyphenol-oxidase in Beta vulgaris. Plant Physiol. 1949;24:1–15. - PMC - PubMed

MeSH terms