. 2002 Nov;130(3):1443-53.
doi: 10.1104/pp.011114.

Salt stress inhibits the repair of photodamaged photosystem II by suppressing the transcription and translation of psbA genes in synechocystis

Affiliations

Salt stress inhibits the repair of photodamaged photosystem II by suppressing the transcription and translation of psbA genes in synechocystis

Suleyman I Allakhverdiev et al. Plant Physiol. 2002 Nov.

Abstract

Light stress and salt stress are major environmental factors that limit the efficiency of photosynthesis. However, we have found that the effects of light and salt stress on photosystem II (PSII) in the cyanobacterium Synechocystis sp. PCC 6803 are completely different. Strong light induced photodamage to PSII, whereas salt stress inhibited the repair of the photodamaged PSII and did not accelerate damage to PSII directly. The combination of light and salt stress appeared to inactivate PSII very rapidly as a consequence of their synergistic effects. Radioactive labeling of cells revealed that salt stress inhibited the synthesis of proteins de novo and, in particular, the synthesis of the D1 protein. Northern- and western-blotting analyses demonstrated that salt stress inhibited the transcription and the translation of psbA genes, which encode D1 protein. DNA microarray analysis indicated that the light-induced expression of various genes was suppressed by salt stress. Thus, our results suggest that salt stress inhibits the repair of PSII via suppression of the activities of the transcriptional and translational machinery.


Figures
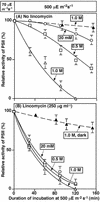
Figure 1
Figure 1
Effects of NaCl and lincomycin on PSII activity during incubation of Synechocystis cells in light. Cells were incubated in light at 500 μE m−2 s−1 in the presence of NaCl at various concentrations. At designated times, a portion of the cell suspension was withdrawn and, after the addition of 1.0 mm 1,4-benzoquinone to the suspension, PSII activity was examined by monitoring the light-dependent evolution of oxygen. The activity that corresponded to 100% was 614 ± 56 μmol O2 mg−1 chlorophyll (Chl) h−1. A, Cells were incubated in the absence of lincomycin. B, Cells were incubated in the presence of 250 μg mL−1 lincomycin. ○, 20 mm NaCl; □, 0.5 m NaCl; ▵, 1.0 m NaCl; ▴, 1.0 m NaCl in darkness. Each point and bar represent the average ± se of results from four independent experiments.
Figure 2
Figure 2
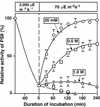
Effects of NaCl and lincomycin on the recovery of the PSII activity of Synechocystis cells from light-induced inactivation. Cells were incubated for 100 min in low-salt medium (20 mm NaCl) in light at 2,000 μE m−2 s−1 to induce 90% inactivation of PSII. Cells were then incubated in light at 70 μE m−2 s−1 in the presence of NaCl at various concentrations and in the presence of 250 μg mL−1 lincomycin or in its absence. At designated times, a portion of the cell suspension was withdrawn, and PSII activity was examined as described in the legend to Figure 1. ○, 20 mm NaCl; □, 0.5 m NaCl; ▵, 1.0 m NaCl. Solid lines, in the absence of lincomycin; dashed line, in the presence of 250 μg mL−1 lincomycin. The activity that corresponded to 100% was 562 ± 49 μmol O2 mg−1 Chl h−1. Each point and bar represent the average ± se of results from five independent experiments.
Figure 3
Figure 3
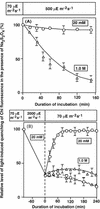
Effects of NaCl on changes in the light-induced quenching of Chl fluorescence during the light-induced inactivation of PSII and its recovery in Synechocystis cells. A, Cells were incubated in light at 500 μE m−2 s−1 at 34°C in the presence of 20 mm or 1.0 m NaCl. At designated times, a portion of the cell suspension was withdrawn and, after the addition of 1 mg mL−1 sodium dithionite, the light-induced quenching of Chl fluorescence was examined at 34°C. ○, 20 mm NaCl; ▵, 1.0 m NaCl. B, Cells were incubated for 100 min at 34°C in low-salt medium (20 mm NaCl) in light at 2,000 μE m−2 s−1, which decreased the light-induced quenching of Chl fluorescence to 65% of the original value. Cells were then incubated at 34°C in light at 70 μE m−2 s−1 in the presence of 20 mm or 1.0 m NaCl and in the presence of 250 μg mL−1 lincomycin or in its absence. At designated times, a portion of the cell suspension was withdrawn and the light-induced quenching of Chl fluorescence was examined at 34°C after the addition of 1 mg mL−1 sodium dithionite. ○, 20 mm NaCl; ▵, 1.0 m NaCl. Solid lines, in the absence of lincomycin; dashed lines in the presence of lincomycin. Each point and bar represent the average ± se of results from four independent experiments.
Figure 4
Figure 4
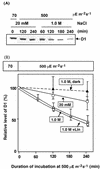
Changes in the level of D1 during the light-induced inactivation of PSII. A, Results of western-blotting analysis. B, Quantitation of the results shown in A. Cells were incubated in light at 500 μE m−2 s−1 in the presence of 20 mm NaCl (○), 1.0 m NaCl (▵), or 1.0 m NaCl plus 250 μg mL−1 lincomycin (□). Cells were also incubated in darkness in the presence of 1.0 m NaCl (▴). At designated times, a portion of the cell suspension was withdrawn and thylakoid membranes were isolated. Proteins were analyzed by PAGE as described in “Materials and Methods.” Each point and bar represent the average ± se of results from four independent experiments.
Figure 5
Figure 5
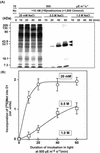
Effects of NaCl on the synthesis of membrane-bound proteins during exposure of Synechocystis cells to light. Cells were incubated with 10 nm [35S]Met in light at 500 μE m−2 s−1 in the presence of 20 mm, 0.5 m, or 1.0 m NaCl. At designated times, a portion of the cell suspension was withdrawn for preparation of thylakoid membranes. Proteins from thylakoid membranes were analyzed by PAGE as described in “Materials and Methods.” Proteins from thylakoid membranes corresponding to 0.8 μg of Chl were applied to each lane. A, Patterns of radiolabeled proteins after PAGE. The top and bottom arrows indicate the positions of D1 (32 kD) and of the NaCl-induced protein of 25 kD, respectively. The results shown are representative of the results of four independent experiments, each of which gave similar results. B, The time course of incorporation of [35S]Met into D1. Each point and bar represent the average ± se of results from four independent experiments. Other details are the same as those described in the legend to Figure 1.
Figure 6
Figure 6
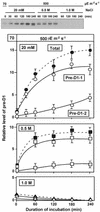
Effects of NaCl on levels of pre-D1 during incubation of Synechocystis cells in light. Cells were incubated in light at 500 μE m−2 s−1 in the presence of 20 mm, 0.5 m, or 1.0 m NaCl. At designated times, a portion of the cell suspension was withdrawn for preparation of thylakoid membranes, which were subjected to western-blotting analysis as described in the text. The results are shown quantitatively in the bottom panels. ○, 20 mm; □, 0.5 m; ▵, 1.0 m NaCl. Open symbols, pre-D1-1 and pre-D1-2 (the top and bottom bands, respectively, on the gel); closed symbols, total pre-D1 (pre-D1-1 plus pre-D1-2). Each point and bar represent the average ± se of results from four independent experiments. Other details are the same as those described in the legend to Figure 1.
Figure 7
Figure 7
Effects of NaCl on the stability of pre-D1 during incubation of Synechocystis cells in the presence of lincomycin. Cells were incubated for 180 min in light at 500 μE m−2 s−1 in 20 mm NaCl. Lincomycin at 250 μg mL−1 was then added together with 0.5 m or 1.0 m NaCl, and incubation was continued in the light at 500 μE m−2 s−1. At designated times, a portion of the cell suspension was withdrawn for preparation of thylakoid membranes, which were subjected to western-blotting analysis as described in the text. Quantitative results of western blotting are shown. ○, 20 mm NaCl in the absence (dashed line) or presence (uninterrupted line) of 250 μg mL−1 lincomycin; □, 0.5 m NaCl in the presence of 250 μg mL−1 lincomycin; ▵, 1.0 m NaCl in the presence of 250 μg mL−1 lincomycin. Each point and bar represent the average ± se of results from three independent experiments.
Figure 8
Figure 8
Effects of NaCl on levels of psbA transcripts during incubation of Synechocystis cells in light. Cells were incubated in light at 500 μE m−2 s−1 in the presence of 20 mm, 0.5 m, or 1.0 m NaCl. At designated times, a portion of the cell suspension was withdrawn for extraction of RNA, which was subjected to northern-blotting analysis as described in the text. The levels of transcripts were normalized by reference to levels of rRNA and the results are shown quantitatively in the bottom panel. ○, 20 mm; □, 0.5 m; ▵, 1.0 m NaCl. Each point and bar represent the average ± se of results from three independent experiments.
Figure 9
Figure 9
Effects of NaCl on the stability of psbA transcripts during incubation of Synechocystis cells in the presence of rifampicin. Cells were incubated for 45 min in light at 500 μE m−2 s−1 in the presence of 20 mm NaCl. Then, 300 μg mL−1 rifampicin was added together with 0.5 m or 1.0 m NaCl, and incubation was continued in light at 500 μE m−2 s−1. At designated times, a portion of the cell suspension was withdrawn for extraction of RNA, which was subjected to northern-blotting analysis as described in the text. The results are shown quantitatively in the bottom panel. The other experimental conditions were the same as those described in the legend to Figure 8. ○, 20 mm; □, 0.5 m; ▵, 1.0 m NaCl. Each point and bar represent the average ± se of results from four independent experiments.
Figure 10
Figure 10
A schematic representation of the proposed steps required for expression of psbA genes and the synthesis of D1, with sites of apparent inhibition by high levels of NaCl (T bars; weaker inhibition is indicated by broken T bars). A, 1.0 m NaCl. B, 0.5 m NaCl.

Similar articles

Cited by

References

    1. Allakhverdiev SI, Klimov VV, Ladygin VG. Photoreduction of pheophytin in photosystem II reaction centers of intact cells of green algae and cyanobacteria under anaerobic conditions. Biofizika (Moscow) 1988;33:442–447. - PubMed
    1. Allakhverdiev SI, Nishiyama Y, Suzuki I, Tasaka Y, Murata N. Genetic engineering of the unsaturation of fatty acids in membrane lipids alters the tolerance of Synechocystis to salt stress. Proc Natl Acad Sci USA. 1999;96:5862–5867. - PMC - PubMed
    1. Allakhverdiev SI, Sakamoto A, Nishiyama Y, Inaba M, Murata N. Ionic and osmotic effects of NaCl-induced inactivation of photosystems I and II in Synechococcus sp. Plant Physiol. 2000b;123:1047–1056. - PMC - PubMed
    1. Allakhverdiev SI, Sakamoto A, Nishiyama Y, Murata N. Inactivation of photosystems I and II in response to osmotic stress in Synechococcus: contribution of water channels. Plant Physiol. 2000a;122:1201–1208. - PMC - PubMed
    1. Arnon DI, McSwain BD, Tsujimoto HY, Wada K. Photochemical activity and components of membrane preparations from blue-green algae: coexistence of two photosystems in relation to chlorophyll a and removal of phycocyanin. Biochim Biophys Acta. 1974;357:231–245. - PubMed

Publication types

MeSH terms

LinkOut - more resources