

Neonatal development of the rat visual cortex: synaptic function of GABAA receptor alpha subunits
- PMID: 12433958
- PMCID: PMC2290648
- DOI: 10.1113/jphysiol.2002.026534
Neonatal development of the rat visual cortex: synaptic function of GABAA receptor alpha subunits
Abstract
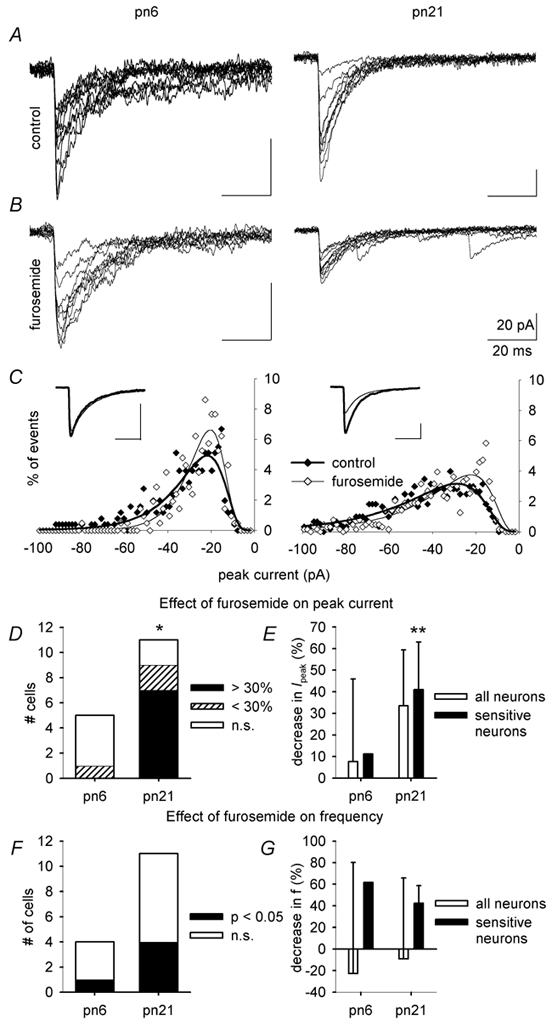
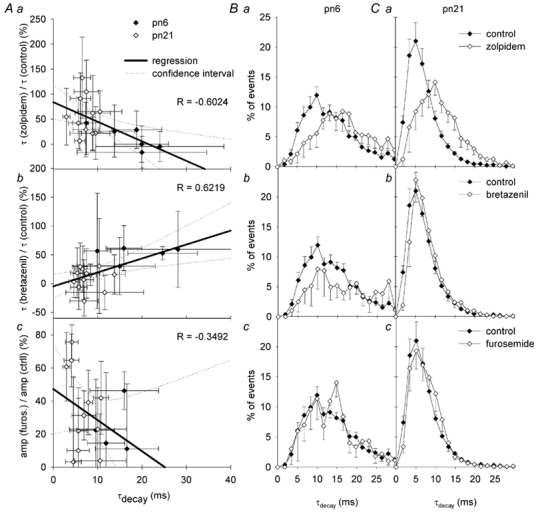
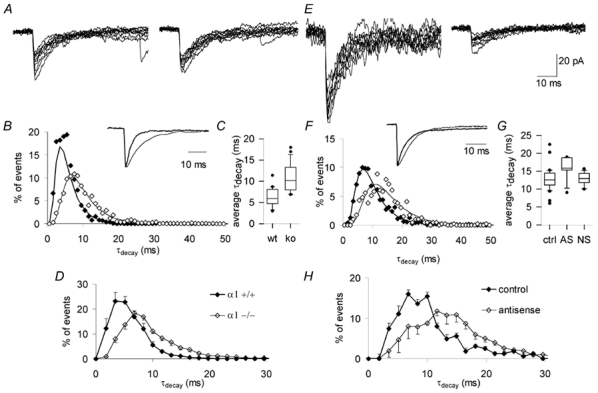
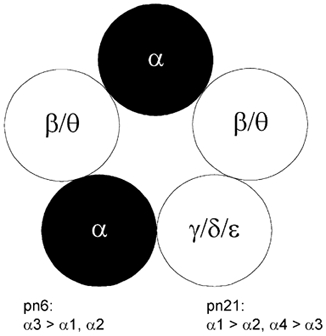
Each GABA(A) receptor consists of two alpha and three other subunits. The spatial and temporal distribution of different alpha subunit isomeres expressed by the CNS is highly regulated. Here we study changes in functional contribution of different alpha subunits during neonatal development in rat visual cortex. First, we characterized postsynaptic alpha subunit expression in layer II-III neurons, using subunit-specific pharmacology combined with electrophysiological recordings in acutely prepared brain slices. This showed clear developmental downregulation of the effects of bretazenil (1 microm) and marked upregulation of the effect of 100 nM of zolpidem on the decay of spontaneous inhibitory postsynaptic currents (sIPSCs). Given the concentrations used we interpret this as downregulation of the synaptic alpha3 and upregulation of alpha1 subunit. Furthermore, the effect of furosemide, being indicative of the functional contribution of alpha4, was increased between postnatal days 6 and 21. Our second aim was to study the effects of plasticity in alpha subunit expression on decay properties of GABAergic IPSCs. We found that bretazenil-sensitive IPSCs have the longest decay time constant in juvenile neurons. In mature neurons, zolpidem- and furosemide-sensitive IPSCs have relatively fast decay kinetics, whereas bretazenil-sensitive IPSCs decay relatively slowly. Analysis of alpha1 deficient mice and alpha1 antisense oligonucleotide deletion in rat explants showed similar results to those obtained by zolpidem application. Thus, distinct alpha subunit contributions create heterogeneity in developmental acceleration of IPSC decay in neocortex.
Figures


Similar articles
-
Setting the time course of inhibitory synaptic currents by mixing multiple GABA(A) receptor α subunit isoforms.J Neurosci. 2012 Apr 25;32(17):5853-67. doi: 10.1523/JNEUROSCI.6495-11.2012. J Neurosci. 2012. PMID: 22539847 Free PMC article.
-
Mice lacking the major adult GABAA receptor subtype have normal number of synapses, but retain juvenile IPSC kinetics until adulthood.J Neurophysiol. 2005 Jul;94(1):338-46. doi: 10.1152/jn.00084.2005. Epub 2005 Mar 9. J Neurophysiol. 2005. PMID: 15758057
-
GABA(A) receptor alpha1 subunit deletion prevents developmental changes of inhibitory synaptic currents in cerebellar neurons.J Neurosci. 2001 May 1;21(9):3009-16. doi: 10.1523/JNEUROSCI.21-09-03009.2001. J Neurosci. 2001. PMID: 11312285 Free PMC article.
-
GABAA receptor maturation in relation to eye opening in the rat visual cortex.Neuroscience. 2004;124(1):161-71. doi: 10.1016/j.neuroscience.2003.11.004. Neuroscience. 2004. PMID: 14960348
-
Role of synaptic inhibition in spatiotemporal patterning of cortical activity.Prog Brain Res. 2005;147:201-4. doi: 10.1016/S0079-6123(04)47015-0. Prog Brain Res. 2005. PMID: 15581707 Review.
Cited by
-
Retinal Electrophysiology Is a Viable Preclinical Biomarker for Drug Penetrance into the Central Nervous System.J Ophthalmol. 2016;2016:5801826. doi: 10.1155/2016/5801826. Epub 2016 Apr 27. J Ophthalmol. 2016. PMID: 27239335 Free PMC article.
-
Organization and emergence of a mixed GABA-glycine retinal circuit that provides inhibition to mouse ON-sustained alpha retinal ganglion cells.Cell Rep. 2021 Mar 16;34(11):108858. doi: 10.1016/j.celrep.2021.108858. Cell Rep. 2021. PMID: 33730586 Free PMC article.
-
Postnatal maturation of GABAergic modulation of sensory inputs onto lateral amygdala principal neurons.J Physiol. 2015 Oct 1;593(19):4387-409. doi: 10.1113/JP270645. Epub 2015 Aug 30. J Physiol. 2015. PMID: 26227545 Free PMC article.
-
Developmental changes in GABAergic mechanisms in human visual cortex across the lifespan.Front Cell Neurosci. 2010 Jun 10;4:16. doi: 10.3389/fncel.2010.00016. eCollection 2010. Front Cell Neurosci. 2010. PMID: 20592950 Free PMC article.
-
Layer-specific noradrenergic modulation of inhibition in cortical layer II/III.Cereb Cortex. 2011 Jan;21(1):212-21. doi: 10.1093/cercor/bhq081. Epub 2010 May 13. Cereb Cortex. 2011. PMID: 20466749 Free PMC article.
References
-
- Araujo F, Tan S, Ruano D, Schoemaker H, Benavides J, Vitorica J. Molecular and pharmacological characterization of native cortical γ-aminobutyric acidA receptors containing both α1 and α3 subunits. Journal of Biological Chemistry. 1996;271:27902–27911. - PubMed
-
- Baker RE, Van Pelt J. Cocultured, but not isolated, cortical explants display normal dendritic development: a long-term quantitative study. Brain Research Developmental Brain Research. 1997;98:21–29. - PubMed
-
- Banerjee PK, Olsen RW, Snead O C III. Zinc inhibition of γ-aminobutyric acidA receptor function is decreased in the cerebral cortex during pilocarpine-induced status epilepticus. Journal of Pharmacology and Experimental Therapeutics. 1999;291:361–366. - PubMed
-
- Baumann SW, Baur R, Sigel E. Subunit arrangement of γ-aminobutyric acid type A receptors. Journal of Biological Chemistry. 2001;276:36275–36280. - PubMed
-
- Blue ME, Parnavelas JG. The formation and maturation of synapses in the visual cortex of the rat. II. Quantitative analysis. Journal of Neurocytology. 1983;12:697–712. - PubMed
Publication types
MeSH terms
Substances
LinkOut - more resources
Full Text Sources
Molecular Biology Databases