. 2002 Nov 15;545(1):183-98.
doi: 10.1113/jphysiol.2002.024877.

Control of intracellular chloride concentration and GABA response polarity in rat retinal ON bipolar cells

Affiliations

Control of intracellular chloride concentration and GABA response polarity in rat retinal ON bipolar cells

Daniela Billups et al. J Physiol. .

Abstract

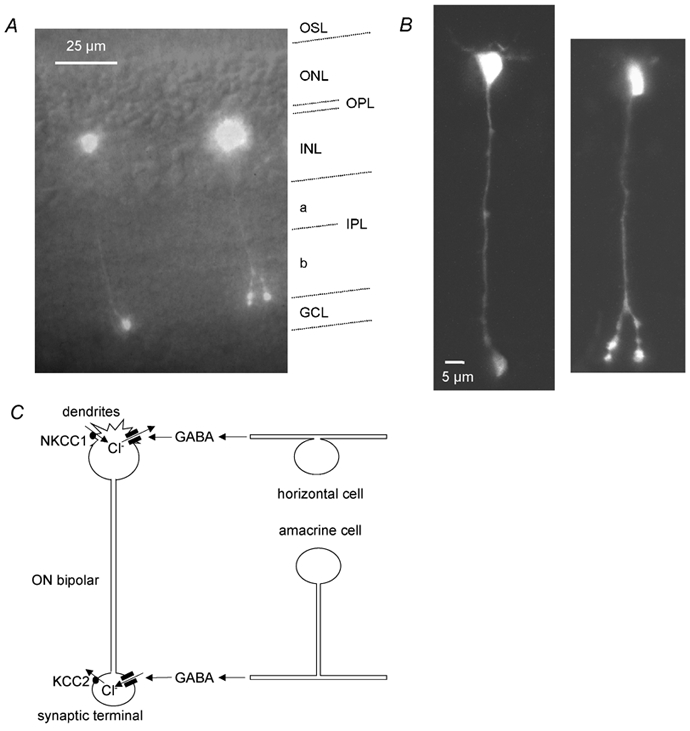
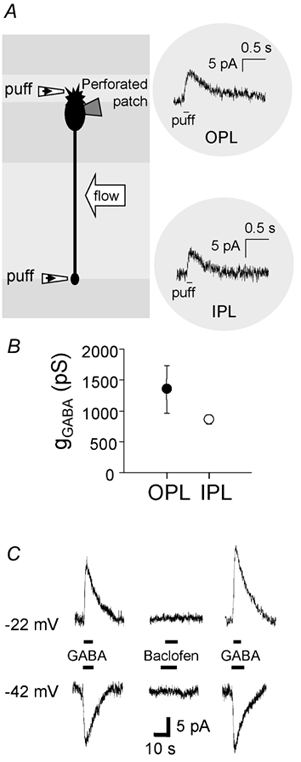
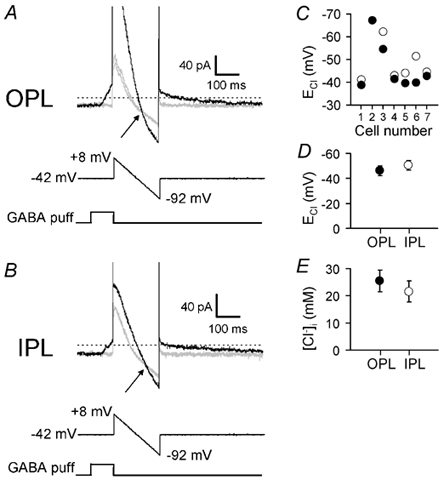
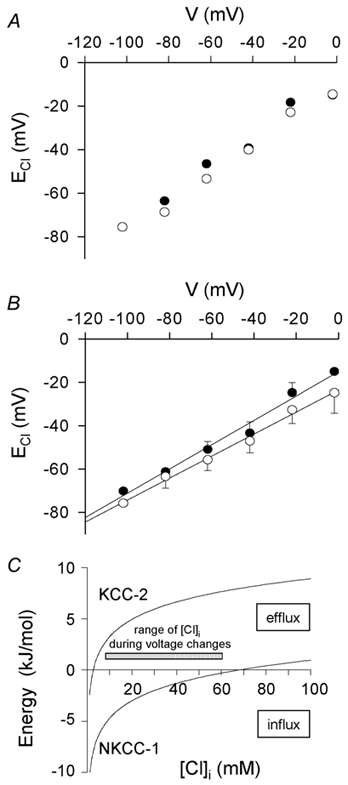
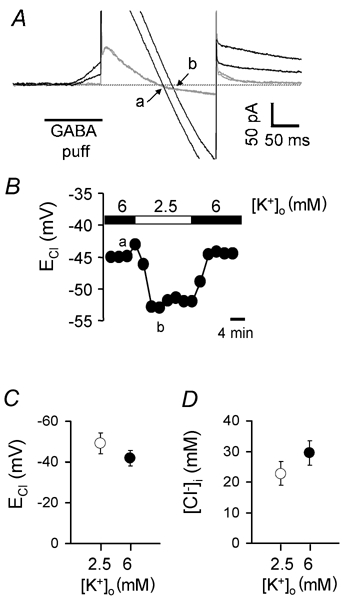
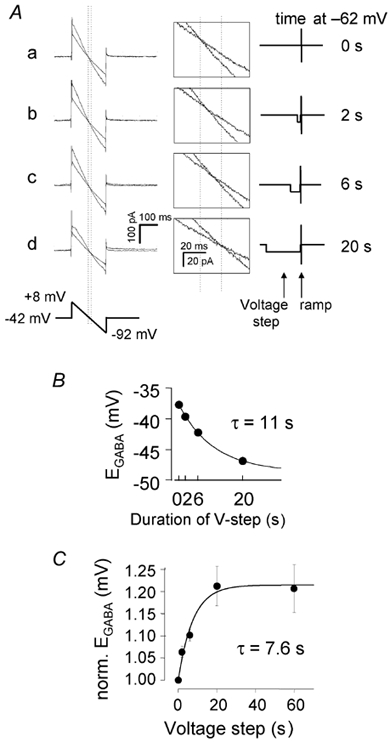
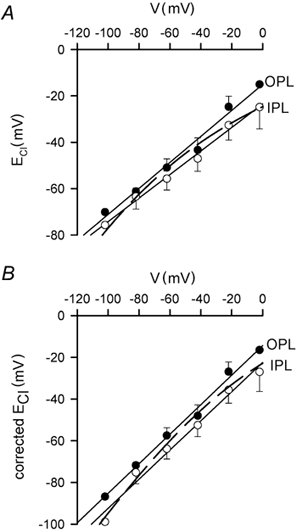
GABAergic modulation of retinal bipolar cells plays a crucial role in early visual processing. It helps to form centre-surround receptive fields which filter the visual signal spatially at the bipolar cell dendrites in the outer retina, and it produces temporal filtering at the bipolar cell synaptic terminals in the inner retina. The observed chloride transporter distribution in ON bipolar cells has been predicted to produce an intracellular chloride concentration, [Cl(-)](i), that is significantly higher in the dendrites than in the synaptic terminals. This would allow dendritic GABA-gated Cl(-) channels to generate the depolarization needed for forming the lateral inhibitory surround of the cell's receptive field, while synaptic terminal GABA-gated Cl(-) channels generate the hyperpolarization needed for temporal shaping of the light response. In contrast to this idea, we show here that in ON bipolar cells [Cl(-)](i) is only slightly higher in the dendrites than in the synaptic terminals, and that GABA-gated channels in the dendrites may generate a hyperpolarization rather than a depolarization. We also show that [Cl(-)](i) is controlled by movement of Cl(-) through ion channels in addition to transporters, that changes of [K(+)](o) alter [Cl(-)](i) and that voltage-dependent equilibration of [Cl(-)](i) in bipolar cells will produce a time-dependent adaptation of GABAergic modulation with a time constant of 8 s after illumination-evoked changes of membrane potential. Time-dependent adaptation of [Cl(-)](i) to voltage changes in retinal bipolar cells may add a previously unsuspected layer of temporal processing to signals as they pass through the retina.


Figures

Figure 1
Figure 1. Morphology, GABAergic inputs and putative Cl transporters of ON bipolar cells
A, fluorescence image of ON bipolars in a retinal slice filled with Lucifer yellow via the whole-cell patch pipette (taken with a CCD camera), with a transmitted light image superimposed to show the retinal layers (labelled at the right-hand side: OSL, photoreceptor outer segment layer; ONL, photoreceptor outer nuclear layer; OPL, outer plexiform layer; INL, inner nuclear layer, IPL, inner plexiform layer divided into the OFF and ON sublaminae a and b, respectively; GCL, ganglion cell layer). Rod ON bipolar cells have their soma in the outermost part of the INL, their dendrites branch in the OPL, and their axon spans the entire IPL before terminating as a large, bulbous axon terminal in the inner part of the IPL (sublamina b), while type 8 and 9 cone ON bipolars have multiple axon terminals less close to the ganglion cell bodies. The cell on the left is a rod ON bipolar cell, whereas the cell on the right could be either a rod bipolar cell or a type 8 cone ON bipolar cell, based on the length of its axon and terminals below the axonal branch point. It is less likely to be a type 9 cone ON bipolar cell because of its restricted dendritic arborization. B, the same cells imaged with a confocal microscope. C, schematic diagram of the GABAergic inputs to ON bipolar cells and the distribution of Cl transporters in these cells (see Introduction). The dendrites in the OPL receive GABAergic input from horizontal cells, and contain NKCC1 transporters in their membranes, which normally accumulate Cl and shift ECl positive to the membrane potential, so GABA evokes a Cl efflux and an inward current. The synaptic terminals in the IPL receive GABAergic input from amacrine cells, and express KCC2 transporters, which normally extrude Cl and shift ECl negative to the membrane potential, so GABA evokes a Cl influx and an outward current.
Figure 2
Figure 2. Response of ON bipolar cells to GABA application at the dendrites and synaptic terminal
A, schematic diagram of the experiment. GABA (100 μm) was pressure-applied to the dendrites or the axon terminal via a small patch pipette (‘puff’). The flow of the bath solution was oriented parallel to the retinal layers to avoid GABA puffed at one plexiform layer being swept to the other plexiform layer. Insets on the right show specimen current responses at −42 mV to GABA puffs at the OPL or IPL. In this cell the reversal potential of the response was negative to −42 mV at both the OPL and the IPL. B, relative magnitude of the conductance evoked by a GABA puff (gGABA) at the dendrites (OPL) and the axon terminal (IPL) of ON bipolar cells (measurements made at both ends of seven cells). The conductance was obtained as described in the Methods, at a time when it had decreased to approximately half its peak value; peak values would be approximately twice the values plotted here. C, specimen traces of currents evoked by bath application of 30 μm GABA and 100 μm baclofen. The ON bipolar cell was voltage clamped at −22 mV (upper panel) or −42 mV (lower panel), bracketing the reversal potential of the GABA response. Baclofen did not evoke a significant current at either potential.
Figure 3
Figure 3. ECl is more negative in the axon terminal than in the dendrites of ON bipolar cells
A, top records: specimen current response of an ON bipolar cell to a voltage ramp from +8 to −92 mV (middle trace, 200 ms duration) applied from a holding potential of −42 mV in control solution (two grey traces, obtained 40 s before and 40 s after the GABA puff) or at the end of a 100 ms puff of 100 μm GABA (black trace) to the OPL. Reversal potential of the GABA-evoked current is at the voltage where the current in the control solution and that in GABA cross (arrow). Current traces have been clipped at positive voltages to show data near the reversal potential at a higher gain. B, as for A (same cell), but applying GABA to the IPL. C, values of chloride reversal potential (ECl) at the OPL (•) and IPL (○) obtained from data as in A and B in seven cells. For cell no. 2 the value was the same at the OPL and IPL. D, mean values of ECl from C. E, mean internal chloride concentration ([Cl]i) at the OPL and IPL calculated from the Nernst equation using ECl measurements as in C.
Figure 4
Figure 4. Adaptation of ECl to the membrane potential, and direction of operation of transporters modulating that adaption
A and B, plots of the steady-state chloride reversal potential (ECl) as a function of the membrane potential (V) in a single cell (A) and averaged data from five cells (B). The membrane potential was changed from the holding potential of −42 mV to a different value for 1–2 min before measuring ECl as in Fig. 3 at the cell's dendrites (OPL, •; in B data are from four cells for V = −42, −62 and −82 mV, three cells for −22 mV, one cell for −2 and −102 mV) or synaptic terminal (IPL, ○; in B data are from five cells for V = −42, −62 and −82 mV, four cells for −22 mV, three cells for −2 mV, two cells for −102 mV; total number of cells studied was five). Lines in B are linear regressions with a slope of 0.56 (OPL) and 0.51 (IPL). C, energy needed to move one mole of chloride ions inwards across the membrane when transported by KCC2 or NKCC1, as a function of [Cl]i, calculated from:for KCC2 and:for NKCC1, with [K+]i = 135 mm, [Na+]i = 12.5 mm, [Cl]o = 145.5 mm, [Na+]o = 147.5 mm and [K+]o = 2.5 mm. Positive values indicate energy values favouring efflux, and negative values indicate energy values favouring influx of chloride. Grey bar indicates the [Cl]i range observed over the voltage change used in A; over most of this range (-22 to −102 mV) KCC2 extrudes and NKCC1 accumulates chloride, but for the [Cl]i reached at the OPL at a holding potential of −2 mV (81 mm) both transporters will mediate efflux of Cl.
Figure 6
Figure 6. The effect of elevated [K+]o on ECl
A, specimen current responses to voltage ramps (as in Figs 3 and 5) in the absence (grey traces) and presence (black traces) of a GABA puff in 6 mm[K+]o (smaller outward current in GABA) or in 2.5 mm[K+]o (larger outward current in GABA). The chloride reversal potential is at the voltage where the current in the control solution and that in GABA cross (arrows: a = 6 mm[K+]o, b = 2.5 mm[K+]o). B, the measured ECl as a function of time during the experiment in A. The lower case letters indicate the times of the specimen traces shown in A. C, average chloride reversal potential (ECl) for five cells bathed in 6 mm[K+]o (•) or in 2.5 mm[K+]o (○). D, average internal chloride concentration ([Cl]i) calculated from the data in C.
Figure 5
Figure 5. Kinetics of the voltage-dependent change of ECl
A, specimen current responses to a voltage ramp applied from a holding potential of −42 mV, in the absence (control, less steep traces during the ramps) and presence (steeper traces)of a preceding 100 ms GABA puff to the OPL. The control voltage ramp was applied 300 ms after the end of a voltage step to −62 mV for 0 (a), 2 (b), 6 (c) or 20 (d) s. Then (after a 40 s interval) the voltage pulse to −62 mV was repeated followed (after 200 ms) by a 100 ms GABA puff and the second voltage ramp was applied. Finally the procedure was repeated again without the GABA puff to test that the second control I-V relation superimposed on the first one as in Fig. 3A (data not shown for clarity). The vertical dotted lines indicate the value of ECl when the cell was either not hyperpolarized (left vertical line) or was hyperpolarized for 20 s (right vertical line). Insets in the middle show the data at higher gain. The voltage protocol is shown on the right. B, reversal potential derived from the traces in A, plotted as a function of the duration of the voltage step to −62 mV. Smooth curve is an exponential with a time constant of 11 s and a maximum change of ECl of 10.9 mV. C, average data for the change of ECl, measured as in A (number of cells per point was 5, 5, 3 and 5 for 2, 6, 20 and 60 s pulses respectively; total number of cells studied was six). For each cell the values of ECl were normalized to the control value of ECl (when the membrane was not hyperpolarized before the voltage ramp), to remove variation due to differences in the initial value of ECl. The line shows the fit of the data with a single exponential of time constant 7.6 s.
Figure 7
Figure 7. Modelling the voltage dependence of ECl
A, data points are the OPL (filled circles) and IPL (open circles) values of ECl from Fig. 4B. The dashed curve is a fit to the data, i.e. eqn (4) with Fn/GCl = 30 mV. B, points show the data in A corrected for the contribution of internal bicarbonate to the reversal potential of the GABA-evoked current. The dashed curve is a fit to the corrected data (derived using eqn (5)), i.e. a modified version of eqn (4) such that ECl and V are equal at −60 mV: ECl = V + (Fn/GCl)(1 - [Cl]i/14 mm) with Fn/GCl = 7 mV. Lines are linear regressions.

References

    1. Akaike N. Gramicidin perforated patch recording and intracellular chloride activity in excitable cells. Progress in Biophysics and Molecular Biology. 1996;65:251–264. - PubMed
    1. Ballanyi K, Grafe P. An intracellular analysis of gamma-aminobutyric-acid-associated ion movements in rat sympathetic neurones. Journal of Physiology. 1985;365:41–58. - PMC - PubMed
    1. Ben-Ari Y, Tseeb V, Raggozzino D, Khazipov R, Gaiarsa JL. γ-Aminobutyric acid (GABA), a fast excitatory transmitter which may regulate the development of hippocampal neurones in early postnatal life. Progress in Brain Research. 1994;102:261–273. - PubMed
    1. Billups D, Hanley JG, Orme M, Attwell D, Moss SJ. GABAC receptor sensitivity is modulated by interaction with MAP1B. Journal of Neuroscience. 2000;20:8643–8650. - PMC - PubMed
    1. Bloomfield SA, Xin D. Surround inhibition of mammalian AII amacrine cells is generated in the proximal retina. Journal of Physiology. 2000;523:771–783. - PMC - PubMed

Publication types

LinkOut - more resources