. 2002 Dec;46(12):3695-705.
doi: 10.1128/AAC.46.12.3695-3705.2002.

Drug susceptibilities of yeast cells are affected by membrane lipid composition

Affiliations

Drug susceptibilities of yeast cells are affected by membrane lipid composition

Kasturi Mukhopadhyay et al. Antimicrob Agents Chemother. 2002 Dec.

Abstract

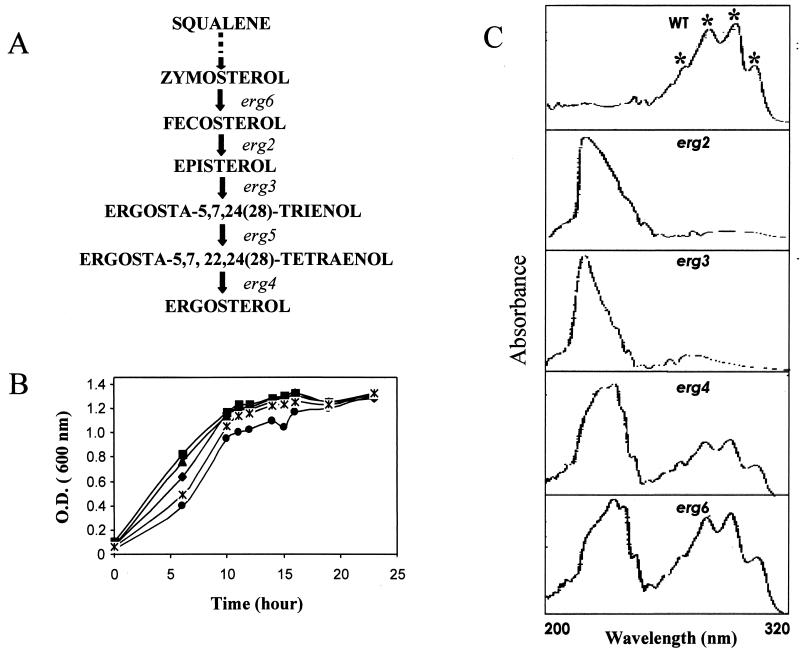
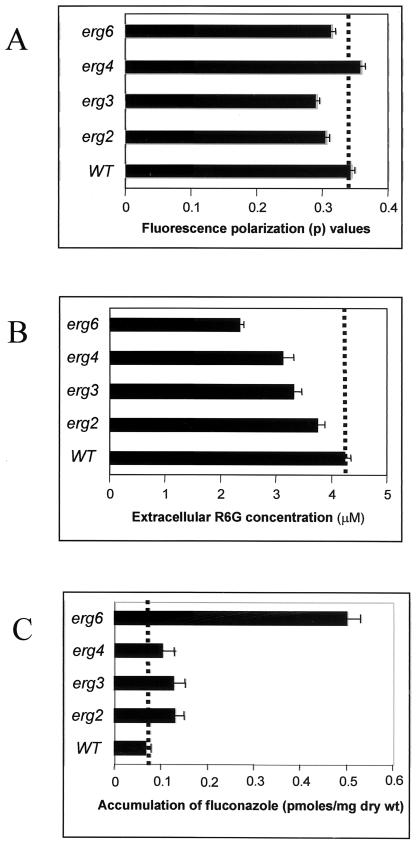
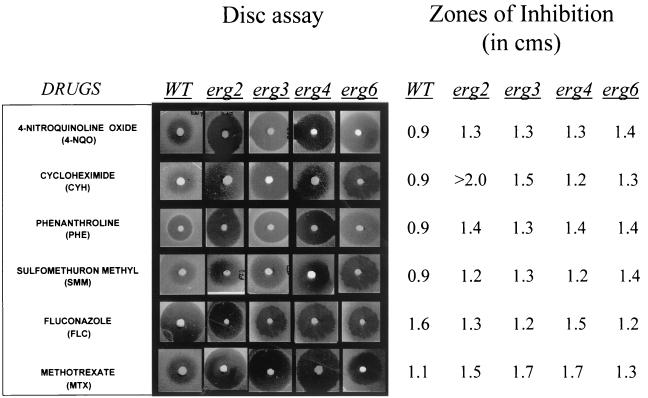
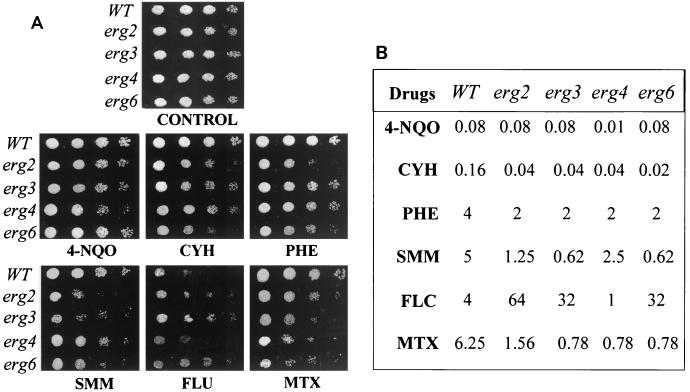
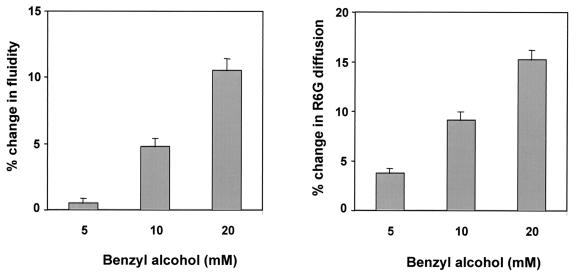
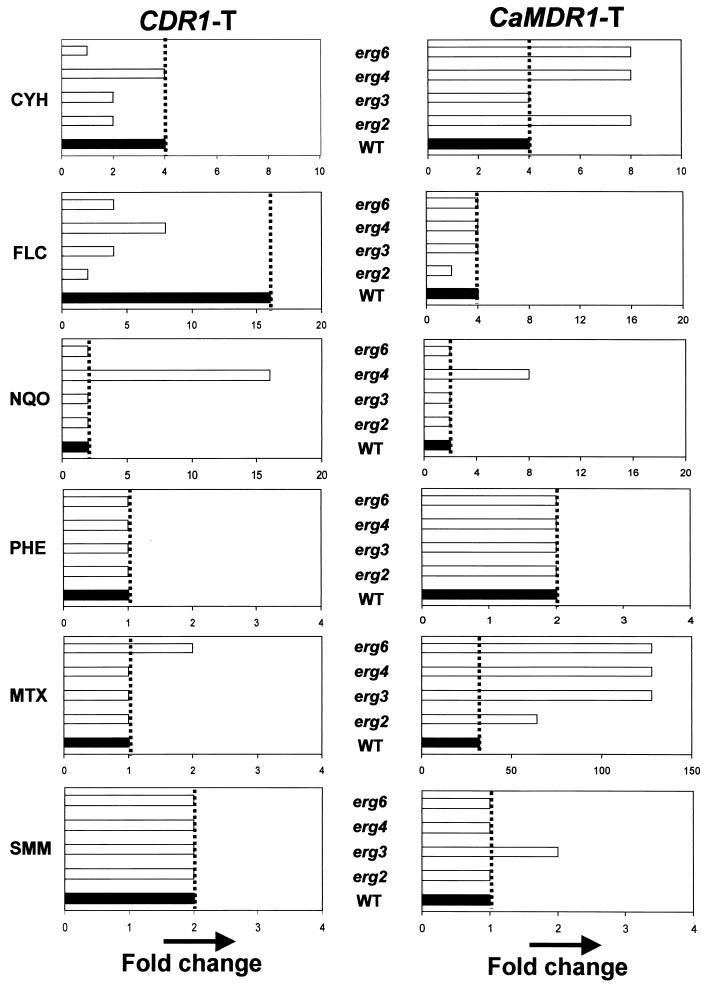
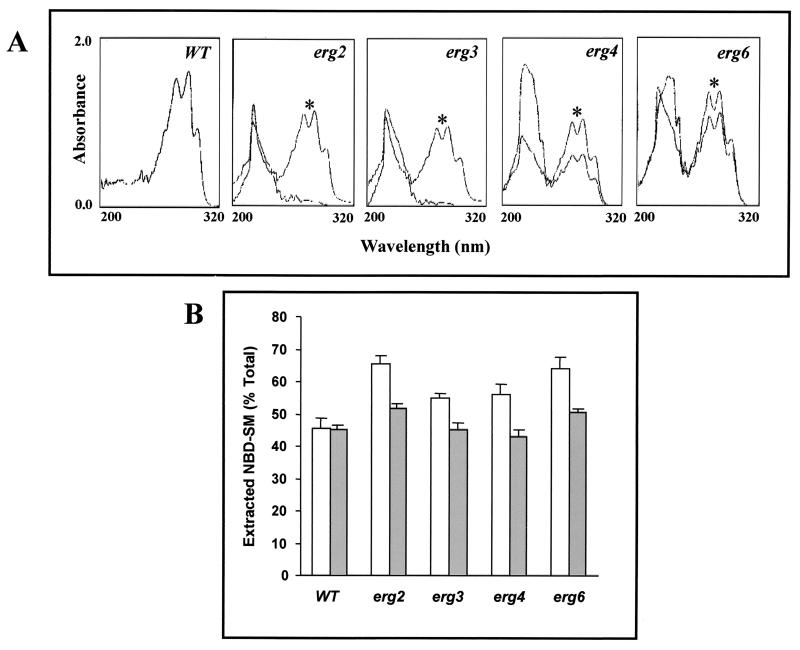
In the present study we have exploited isogenic erg mutants of Saccharomyces cerevisiae to examine the contribution of an altered lipid environment on drug susceptibilities of yeast cells. It is observed that erg mutants, which possess high levels of membrane fluidity, were hypersensitive to the drugs tested, i.e., cycloheximide (CYH), o-phenanthroline, sulfomethuron methyl, 4-nitroquinoline oxide, and methotrexate. Most of the erg mutants except mutant erg4 were, however, resistant to fluconazole (FLC). By using the fluorophore rhodamine-6G and radiolabeled FLC to monitor the passive diffusion, it was observed that erg mutant cells elicited enhanced diffusion. The addition of a membrane fluidizer, benzyl alcohol (BA), to S. cerevisiae wild-type cells led to enhanced membrane fluidity. However, a 10 to 12% increase in BA-induced membrane fluidity did not alter the drug susceptibilities of the S. cerevisiae wild-type cells. The enhanced diffusion observed in erg mutants did not seem to be solely responsible for the observed hypersensitivity of erg mutants. In order to ascertain the functioning of drug extrusion pumps encoding the genes CDR1 (ATP-binding cassette family) and CaMDR1 (MFS family) of Candida albicans in a different lipid environment, they were independently expressed in an S. cerevisiae erg mutant background. While the fold change in drug resistance mediated by CaMDR1 remained the same or increased in erg mutants, susceptibility to FLC and CYH mediated by CDR1 was increased (decrease in fold resistance). Our results demonstrate that between the two drug extrusion pumps, Cdr1p appeared to be more adversely affected by the fluctuations in the membrane lipid environment (particularly to ergosterol). By using 6-[(7-nitrobenz-2-oxa-1,3-diazol-4-yl) amino-hexanoyl] sphingosyl phosphocholine (a fluorescent analogue of sphingomyelin), a close interaction between membrane ergosterol and sphingomyelin which appears to be disrupted in erg mutants is demonstrated. Taken together it appears that multidrug resistance in yeast is closely linked to the status of membrane lipids, wherein the overall drug susceptibility phenotype of a cell appears to be an interplay among drug diffusion, extrusion pumps, and the membrane lipid environment.


Figures

FIG. 1.
FIG. 1.
(A) Schematic representation of the late stages of the ergosterol biosynthetic pathway. erg6, erg2, erg3, erg5, and erg4 encode S-adenosyl methionine methyltransferase, C-8 sterol isomerase, sterol C-5 desaturase, C-22 sterol desaturase, and sterol-24(28) reductase, respectively. (B) Growth curves of WT (♦), erg2 (▪), erg3 (▴), erg4 (•), and erg6 (∗) strains. The specific growth rates are 1.76 h for WT, 2.01 h for erg2, 1.78 h for erg3, 1.52 h for erg4, and 1.71 h for erg6. (C) UV absorption spectra of sterols extracted from the S. cerevisiae WT strain and its erg mutants. Their absorption spectra were recorded as described in Materials and Methods.
FIG. 2.
FIG. 2.
(A) Steady-state fluorescence polarization measurements (p value) in an S. cerevisiae WT strain and its erg mutants. Measurements were carried out with intact cells by using DPH as the fluorescent probe at excitation and emission wavelengths of 360 and 450 nm, respectively, as described in Materials and Methods. The values are means ± standard deviations (indicated by the bars) of three independent experiments. (B) Extracellular R6G concentration measured in S. cerevisiae WT and its erg mutants at 60-min interval. Deenergized yeast cells were incubated with R6G for 1 h, after which the cells were harvested and the extracellular concentration of R6G in the supernatant was determined spectrophotometrically by measuring the absorbance at 527 nm. The values are means ± standard deviations (indicated by the bars) of three independent experiments. (C) Accumulation of [3H]FLC in deenergized S. cerevisiae WT and its erg mutants at 60-min intervals. The values are means ± standard deviations (indicated by the bars) of three independent experiments.
FIG. 3.
FIG. 3.
Drug resistance profiles of S. cerevisiae WT and erg mutants determined by filter disk assay as described in Materials and Methods. The numbers on the right represent zones of inhibition measured from the zones shown on the left.
FIG. 4.
FIG. 4.
Drug resistance profiles of S. cerevisiae WT and erg mutants determined by the spot assay (A) and the microtiter assay (B). (A) For the spot assay, the yeast cells were grown overnight on YNB plates at 30°C. The cells were then suspended in normal saline to an OD600 of 0.01 (A600). Five microliters of fivefold serial dilutions of each yeast culture was spotted onto YNB plates in the absence (control) and presence of the following drugs: 4-NQO (0.02 μg ml−1), CYH (0.01 μg ml−1), PHE (2 μg ml−1), SMM (1 μg ml−1), FLC (8 μg ml−1), and MTX (1 μg ml−1). Growth differences were recorded following incubation of the plates for 48 h at 30°C. Growth was not affected by the presence of the solvents used for the drugs (B) The microtiter assay (MIC80) was done as described in Materials and Methods.
FIG. 5.
FIG. 5.
Measurement of membrane fluidity and passive diffusion of S. cerevisiae WT cells induced by BA. Fluidity was determined by measuring the steady-state fluorescence polarization with DPH as the fluorescent probe as described in the legend for Fig. 2A. Diffusion was determined by measuring the extracellular R6G concentration as described in the legend for Fig. 2B. The values are means ± standard deviations (indicated by the bars) of three independent experiments.
FIG. 6.
FIG. 6.
Graphical representations showing the fold increase in drug resistance of WT and erg mutant strains of S. cerevisiae upon transformation with Cdr1p- and CaMdr1p-encoding plasmids (see Materials and Methods). The fold increase in resistance to each drug was calculated as the difference in resistance between the nontransformant and transformant pair for each cell type. MTX is the substrate for CaMdr1p (24), and the fold change in resistance is much higher for CaMDR1-transformed erg mutant cells than for CDR1-transformed erg mutant cells. Note the change in the x axis for fold MTX resistance.
FIG. 7.
FIG. 7.
(A) UV absorption spectra of sterols extracted from the S. cerevisiae WT strain and its erg mutants grown in the absence and in the presence (∗) of ergosterol. The cells were supplemented with 10 μg of ergosterol ml−1 and grown for 20 h at 30°C before lipid extraction. The supplemented cells were harvested and washed thoroughly before extraction of sterols as described in Materials and Methods. The UV spectra of WT cells were the same as those of the unsupplemented cells; hence, only one trace is shown in the first panel. (B) Postlabeling transbilayer exchange of NBD-SM in the S. cerevisiae WT and its erg mutants. Cells were grown in the absence (open bar) and presence (filled bar) of ergosterol-supplemented media as described in Materials and Methods. NBD-SM labeled cells were washed twice with buffer A and were then incubated with 2% BSA to back exchange the NBD-SM from the labeled cells, as described in Materials and Methods. The percentage of total extracted NBD-SM was calculated (according to the formula given in Materials and Methods). The graph presents data for the 90-min time point during which the maximum back-exchanged fluorescence in the supernatant was observed. The values are the means ± standard deviations (indicated by the bars) of three independent experiments.

Similar articles

Cited by

References

    1. Ansari, S., P. Gupta, S. K. Mahanty, and R. Prasad. 1993. The uptake of amino acids by erg mutants of Candida albicans. J. Med. Vet. Mycol. 31:377-386.
    1. Arthington-Skaggs, B. A., H. Jradi, T. Desai, and C. J. Morrison. 1999. Quantitation of ergosterol content: novel method for determination of fluconazole susceptibility of Candida albicans. J. Clin. Microbiol. 37:3332-3337. - PMC - PubMed
    1. Arthington-Skaggs, B., W. Lee-Yang, M. A. Ciblak, J. P. Frade, M. E. Brandt, R. A. Hajjeh, L. H. Harrison, A. N. Sofair, and D. W. Warnock. 2002. Comparison of visual and spectrophotometric methods of broth microdilution MIC end point determination and evaluation of a sterol quantitation method for in vitro susceptibility testing of fluconazole and itraconazole against trailing and nontrailing Candida isolates. Antimicrob. Agents Chemother. 46:2477-2481. - PMC - PubMed
    1. Bagnat, M., S. Keranen, A. Shevchenko, A. Shevchenko, and K. Simons. 2000. Lipid rafts function in biosynthetic delivery of proteins to the cell surface in yeast. Proc. Natl. Acad. Sci. USA 97:3254-3259. - PMC - PubMed
    1. Debry, P., E. A. Nash, D. W. Nekalson, and J. E. Metherall. 1997. Role of multidrug resistance P-glycoproteins in cholesterol esterification. J. Biol. Chem. 272:1026-1031. - PubMed

Publication types

MeSH terms

LinkOut - more resources