. 2002 Nov 6;1(2):10.
doi: 10.1186/1475-4924-1-10.

Small-molecule modulators of Hedgehog signaling: identification and characterization of Smoothened agonists and antagonists

Affiliations

Small-molecule modulators of Hedgehog signaling: identification and characterization of Smoothened agonists and antagonists

Maria Frank-Kamenetsky et al. J Biol. .

Abstract

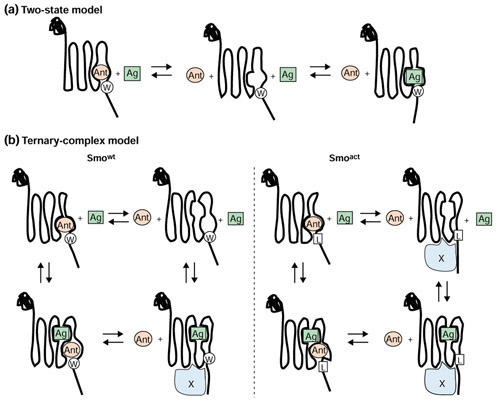
Background: The Hedgehog (Hh) signaling pathway is vital to animal development as it mediates the differentiation of multiple cell types during embryogenesis. In adults, Hh signaling can be activated to facilitate tissue maintenance and repair. Moreover, stimulation of the Hh pathway has shown therapeutic efficacy in models of neuropathy. The underlying mechanisms of Hh signal transduction remain obscure, however: little is known about the communication between the pathway suppressor Patched (Ptc), a multipass transmembrane protein that directly binds Hh, and the pathway activator Smoothened (Smo), a protein that is related to G-protein-coupled receptors and is capable of constitutive activation in the absence of Ptc.

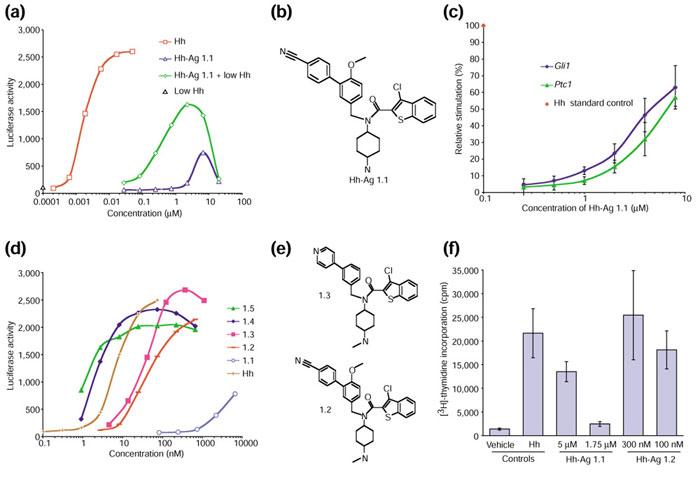
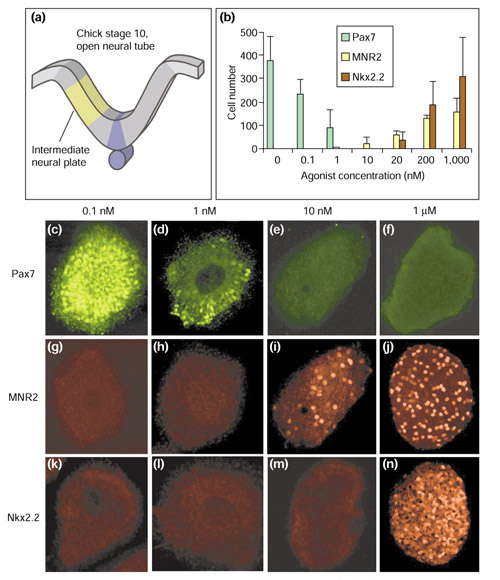
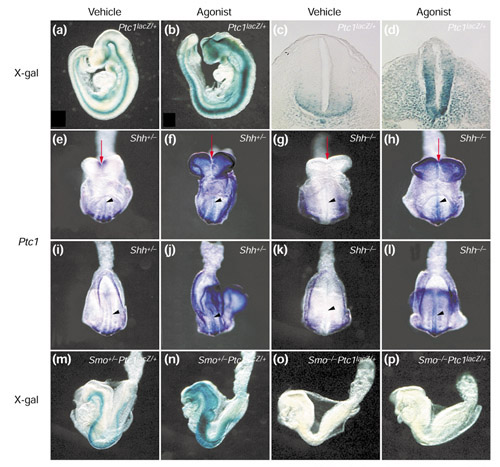
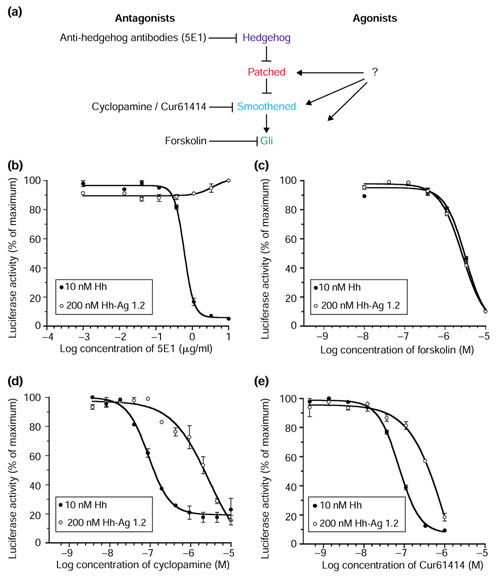
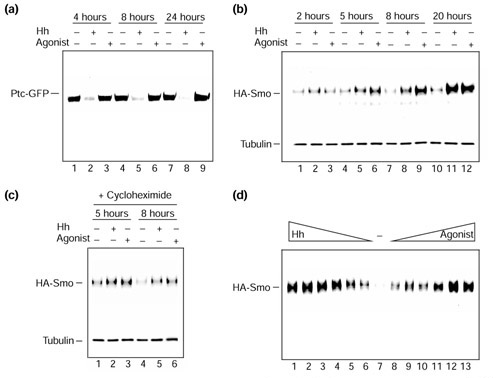
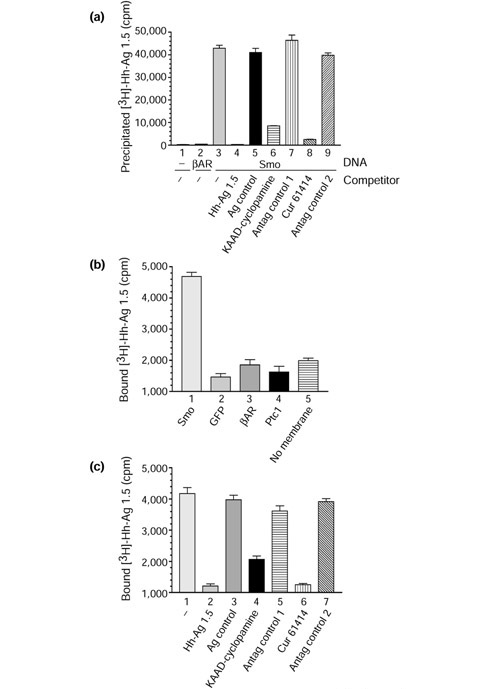
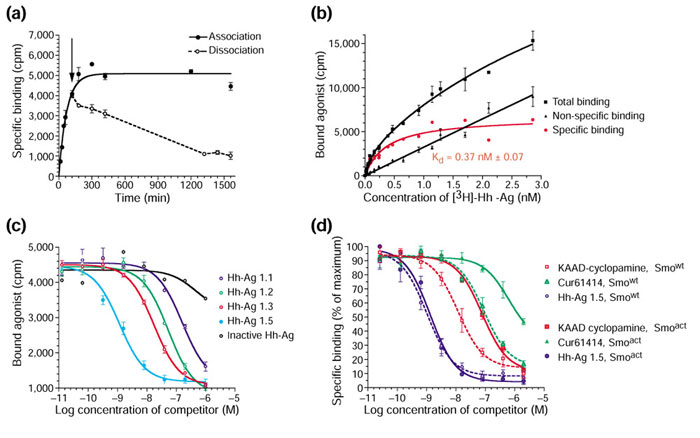
Results: We have identified and characterized a synthetic non-peptidyl small molecule, Hh-Ag, that acts as an agonist of the Hh pathway. This Hh agonist promotes cell-type-specific proliferation and concentration-dependent differentiation in vitro, while in utero it rescues aspects of the Hh-signaling defect in Sonic hedgehog-null, but not Smo-null, mouse embryos. Biochemical studies with Hh-Ag, the Hh-signaling antagonist cyclopamine, and a novel Hh-signaling inhibitor Cur61414, reveal that the action of all these compounds is independent of Hh-protein ligand and of the Hh receptor Ptc, as each binds directly to Smo.

Conclusions: Smo can have its activity modulated directly by synthetic small molecules. These studies raise the possibility that Hh signaling may be regulated by endogenous small molecules in vivo and provide potent compounds with which to test the therapeutic value of activating the Hh-signaling pathway in the treatment of traumatic and chronic degenerative conditions.


Figures

Figure 1
Figure 1
A Hh-signaling agonist identified in a cell-based small-molecule screen. (a) A luciferase-based reporter assay of Hh signaling, showing a dose-response curve for the following: Hh protein (Hh); the small-molecule agonist Hh-Ag 1.1; Hh-Ag 1.1 in the presence of 0.3 nM Hh protein (Hh-Ag 1.1 + low Hh); or 0.3 nM Hh protein alone (low Hh). Data points represent the averages (n = 4) with standard deviations less than 15%. (b) The structure of Hh-Ag 1.1. (c) The output of a quantitative PCR analysis of Ptc1 and Gli1 mRNA levels from C3H10T1/2 cells exposed for 18 hours to an increasing dose of Hh-Ag 1.1. Data are graphed as relative activation versus Hh-Ag 1.1 concentration (μM). The 0 to 100% range was set using data from cells treated with 0 or 25 nM Hh protein; fold inductions for levels of Ptc1 and Gli1 mRNA were determined using GAPDH mRNA levels as internal standards. Each data point represents an average (n = 4) with standard deviation shown by error bars. (d) A luciferase-based reporter assay of Hh signaling showing dose-response curves (with concentrations in nM) for Hh protein and the five agonist compounds Hh-Ag 1.1, 1.2, 1.3, 1.4 and 1.5. Graphs are representative of multiple assays of these compounds. Data points represent the averages (n = 2) with standard deviations less than 15%. (e) Structures of Hh-agonist derivatives; 1.2 is a methylated analog, and 1.3 a methylated analog with a para-pyridyl moiety. (f) A proliferation assay of Hh-responsive primary neuronal precursors from postnatal day 4 rat cerebellum. [3H]-thymidine incorporation was measured 24 hours after the addition of the vehicle dimethyl sulfoxide ('vehicle'), Hh protein, or agonist. Hh protein was tested at 50 nM; Hh-Ag 1.1 was added at 5 and 1.75 μM; Hh-Ag 1.2 was added at 300 and 100 nM. Data points represent the averages (n = 4) with standard deviations depicted with error bars.
Figure 2
Figure 2
The concentration-dependent response to Hh agonist of neural progenitor markers in neural plate explants. (a) The intermediate region of neural plate was dissected from stage 10-11 chick embryos and cultured in the presence of varying concentrations of Hh-Ag 1.3 (agonist) for 22 hours. Explants were then immunostained for Pax7, MNR2 and Nkx2.2 and the number of immunoreactive cells per explant was counted. (b) The average number of immunoreactive cells per explant in response to increasing concentrations of Hh-Ag 1.3 (n = 6 explants). Error bars represent standard deviations. (c-n) Confocal images of representative explants cultured in the presence of different concentrations of the agonist and stained for (c-f) Pax7; (g-j) MNR2; and (k-n) Nkx2.2. Pax7 is expressed only at the lowest concentrations of the agonist (c,d), MNR2 at intermediate and high concentrations (i,j), and Nkx2.2 only at high concentrations of agonist (n).
Figure 3
Figure 3
In vivo assays of an Hh agonist. (a-d) The Hh agonist Hh-Ag 1.2 up-regulates Hh signaling in mouse embryos in utero. Expression of Ptc1lacZ in E9.5 Ptc1lacZ/+ embryos after treatment with vehicle (a,c) or Hh-Ag 1.2 (b,d). (a,b) Lateral views of whole embryos stained with X-gal; (c,d) transverse sections through E9.5 embryos following X-gal staining. Ptc1 expression is dorsally expanded throughout the ventral neural tube and adjacent mesoderm in agonist-treated embryos (compare b,d with a,c). Note the open neural tube in the head of these embryos (b). (e-p) The agonist complements the loss of Shh but requires Smo to activate Hh signaling in utero. (e-l) Whole-mount in situ hybridization analyses of the expression of Ptc1 gene in E8.5 embryos (n = 4); (e-h) ventral anterior views, and (i-l) ventral posterior views, of embryos heterozygous (e,f,i,j) or homozygous (g,h,k,l) for an Shh-null allele. (m-p) Lateral views of X-gal staining of Ptc1lacZ expression in E8.5 Ptc1lacZ/+ embryos (n = 4) heterozygous (m,n) or homozygous (o,p) for a Smo-null allele. (e,g,i,k,m,o) Vehicle-treated embryos; (f,h,j,l,n,p) Hh-Ag 1.2- (agonist-) treated embryos. Red arrows in (e-h) indicate the partial rescue of midline structures in Shh-/- embryos (g) by agonist treatment (h). Black arrowheads in (e-l) indicate expression in the midline.
Figure 4
Figure 4
Analysis of the agonist's site of action, using characterized Hh-pathway antagonists. (a) The Hh-signaling pathway. The major components are shown, along with the suspected sites of action of four antagonists: 5E1, the Hh-ligand-binding/blocking monoclonal antibody; cyclopamine, the natural product inhibitor, activity of which maps downstream of Ptc; forskolin, the adenylate cyclase activator that functions via protein kinase A to activate destruction of Ci/Gli; and a recently identified Hh-signaling antagonist Cur61414. Lines with arrowheads represent activation and blunt-ended lines represent repression. (b-e) Luciferase-based reporter assays of Hh signaling showing inhibitory dose response on cells activated by Hh protein (10 nM) or Hh-Ag 1.2 (200 nM) of (b) 5E1; (c) forskolin; (d) cyclopamine; and (e) Cur61414. Data points represent the averages (n = 3) with standard deviations depicted by error bars.
Figure 5
Figure 5
The effects of Hh protein and agonist on vertebrate Smo and Ptc proteins. A stable cell line expressing Ptc-GFP and HA-Smo retroviral constructs was generated to evaluate the effects of Hh protein versus agonist on the Hh receptor components. (a) Anti-Ptc protein blot of anti-GFP immunoprecipitates, fractionated by SDS-polyacrylamide gel electrophoresis, from cells treated with vehicle (lanes 1,4,7), 25 nM Hh protein (lanes 2,5,8) or 0.2 μM Hh-Ag 1.2 (agonist; lanes 3,6,9), for 4 hours (lanes 1-3), 8 hours (lanes 4-6) or 24 hours (lanes 7-9). (b) Anti-HA protein blot of cell extracts, fractionated by SDS-polyacrylamide gel electrophoresis, from cells treated with vehicle (lanes 1,4,7,10), 35 nM Hh protein (lanes 2,5,8,11) or 0.5 μM Hh-Ag 1.2 (agonist; lanes 3,6,9,12), for 2 hours (lanes 1-3), 5 hours (lanes 4-6), 8 hours (lanes 7-9) or 20 hours (lanes 10-12). (c) Anti-HA protein blot of cell extracts, fractionated by SDS-polyacrylamide gel electrophoresis, from cells treated with vehicle (lanes 1,4), 35 nM Hh protein (lanes 2,5), or 0.5 μM Hh-Ag 1.2 (agonist; lanes 3,6), for 5 hours (lanes 1-3) or 8 hours (lanes 4-6). Cells used in (c) were also treated with cycloheximide to block new protein synthesis. Blots in (b) and (c) were reprobed with anti-tubulin antibody as a sample loading control. (d) Anti-HA protein blot of cell extracts, fractionated by SDS-polyacrylamide gel electrophoresis, from cells treated with decreasing concentrations of Hh protein (lane 1, 100 nM; lane 2, 50 nM; lane 3, 25 nM; lane 4, 12.5 nM; lane 5, 6.25 nM; lane 6, 3.12 nM), or with vehicle (lane 7), or with increasing concentrations of Hh-Ag 1.2 (agonist; lane 8, 15 nM; lane 9, 31.25 nM; lane 10, 62.5 nM; lane 11, 250 nM; lane 12, 500 nM; lane 13, 1 μM) for 22 hours. All blots were visualized by autoradiography using anti-HRP (horse radish peroxidase) secondary antibodies and a chemiluminescence reagent kit (Amersham).
Figure 6
Figure 6
Assessing whether Smoothened is the molecular target of the Hh agonist. (a) The number of counts per minute (cpm) precipitated from an immunocomplex binding assay of 293T cells incubated with [3H]-Hh-Ag 1.5. Anti-HA (columns 1,3-9) or anti-v5 (column 2) immunocomplexes were isolated from 293T cells that were untransfected (column 1) or transfected with expression constructs encoding a rat β2-adrenergic receptor cDNA carrying a v5 epitope tag (column 2; βAR), or an HA-epitope-tagged Smo cDNA (columns 3-9). Prior to cell lysis and immunoprecipitations, these cells were incubated with 5 nM [3H]-Hh-Ag 1.5 alone (columns 1-3) or with 5 nM [3H]-Hh-Ag 1.5 in the presence of 5 μM of various unlabeled compounds (columns 4-9): Hh-Ag 1.5 (column 4); an inactive Hh-Ag 1.1-derivative containing a two-carbon linker instead of the cyclohexane ring (Ag control, column 5); the potent natural product Hh-signaling-inhibitor derivative KAAD-cyclopamine (column 6); the inactive natural product tomatadine (Antag control 1, column 7); the synthetic Hh-signaling inhibitor Cur61414 (column 8); or an inactive derivative of Cur61414 (Antag control 2, column 9). Standard deviations (n = 2) are represented by error bars. (b,c) Filtration membrane-binding assay using [3H]-Hh-Ag 1.5 (2 nM) and membranes (approximately 5 μg protein) from 293T cells transfected with different cDNA constructs. (b) Bound [3H]-Hh-agonist (cpm) when using membranes from cells transfected with murine Smo (column 1); GFP (column 2); rat β2-adrenergic receptor (βAR, column 3), and murine Ptc1 (column 4). A no-membrane control (column 5) is also included, to demonstrate the level of nonspecific binding associated with the filtration plate apparatus. (c) A competition experiment using membranes from cells transfected with murine Smo and incubated with [3H]-Hh-Ag 1.5 (2 nM) in the presence of various unlabeled compounds: no competitor (-, column 1); 2 μM unlabeled Hh-Ag 1.5 (column 2); 2 μM inactive Hh-Ag 1.1 derivative (Ag control, column 3); KAAD-cyclopamine (column 4); tomatadine (Antag control 1, column 5); Cur61414 (column 6); or an inactive derivative of Cur61414 (Antag control 2, column 7). Standard deviations (n = 4) are represented by error bars.
Figure 7
Figure 7
[3H]-Hh-agonist kinetic, saturation and competition binding analysis with Smo-containing membranes. (a) The association (solid line) and dissociation (broken line) time courses for the binding of [3H]-Hh-Ag 1.5 to membranes from Smo-overexpressing 293T cells. The arrow denotes the time at which 2 μM unlabeled [3H]-Hh-Ag 1.5 was added to initiate dissociation studies. (b) The total (squares), nonspecific (triangles) and specific (circles) binding (in cpm) of [3H]-Hh-Ag 1.5 to membranes from Smo-overexpressing 293T cells. Total and specific binding data were derived in the absence and presence of 2 μM unlabeled Hh-Ag 1.5, respectively. The specific curve (red) represents the difference between these curves. Similar specific curves resulted when control membranes or a no-membrane control plate was used to define the nonspecific binding, or if 10 μM Cur61414 was used as the competitor. A dissociation binding constant (Kd) of 0.37 nM is predicted from this single site binding isotherm. (c) A competition assay of [3H]-Hh-Ag 1.5/Smo binding by a set of agonist derivatives including Hh-Ag 1.5, Hh-Ag 1.3, Hh-Ag 1.2, Hh-Ag 1.1, and an inactive Hh-agonist derivative. (d) A competition binding study showing the properties of the binding of KAAD-cyclopamine, Cur61414 and Hh-Ag 1.5 to wild-type Smo, Smowt, and a constitutively active Smo mutant protein, Smoact, which contains an activating W539L amino-acid substitution. Competition curves on Smowt are shown by broken lines and the competition curves on Smoact by solid lines. Standard deviations (n = 4) are represented by error bars for all data points.
Figure 8
Figure 8
Models of small-molecule modulators binding to Smo. (a) The two-state model shows direct competition for a single binding site between the agonist (Ag, green square) and the antagonist (Ant, pink circle). (b) The ternary complex model suggests that there are two independent sites, and that agonist and antagonists are in a dynamic equilibrium (denoted by arrows) between Smo conformers bound at one site, both sites or not bound by ligand. On the basis of experimental data, binding at either site would decrease the affinity of interaction at the other site (allosteric binding with high negative cooperativity). A hypothetical signal transduction coupler, or effector, (the blue structure labeled X) is introduced in the ternary complex model. A coupler/effector-bound form is considered to be the active signaling complex. According to the model, only single active agonist-bound species of Smowt is seen (bottom left). For Smoact (bottom right), the model predicts that the activating point mutation, W539L, results in a stable, distorted form of Smo that binds the antagonist poorly and has an increased affinity for the coupler/effector, even in the absence of agonist, thus leading to elevated basal signaling. This mutant form can nevertheless bind agonist and assume a conformation like that of the normal activated Smowt. Residue 539 is designated as either W for Smowt or as L in the Smoact mutant.

References

    1. Nusslein-Volhard C, Wieschaus E. Mutations affecting segment number and polarity in Drosophila. Nature. 1980;287:795–801. - PubMed
    1. Ingham PW, McMahon AP. Hedgehog signaling in animal development: paradigms and principles. Genes Dev. 2001;15:3059–3087. - PubMed
    1. Xie J, Murone M, Luoh SM, Ryan A, Gu Q, Zhang C, Bonifas JM, Lam CW, Hynes M, Goddard A, et al. Activating Smoothened mutations in sporadic basal-cell carcinoma. Nature. 1998;391:90–92. - PubMed
    1. Stone DM, Hynes M, Armanini M, Swanson TA, Gu Q, Johnson RL, Scott MP, Pennica D, Goddard A, Phillips H, et al. The tumour-suppressor gene patched encodes a candidate receptor for Sonic hedgehog. Nature. 1996;384:129–134. - PubMed
    1. Denef N, Neubuser D, Perez L, Cohen SM. Hedgehog induces opposite changes in turnover and subcellular localization of patched and smoothened. Cell. 2000;102:521–531. - PubMed

MeSH terms