. 2002 Nov 18;196(10):1291-305.
doi: 10.1084/jem.20020881.

Silencing of B cell receptor signals in human naive B cells

Affiliations

Silencing of B cell receptor signals in human naive B cells

Niklas Feldhahn et al. J Exp Med. .

Retraction in

  • Retraction.
    Feldhahn N, Schwering I, Lee S, Wartenberg M, Klein F, Wang H, Zhou G, Wang SM, Rowley JD, Hescheler J, Krönke M, Rajewsky K, Küppers R, Müschen M. Feldhahn N, et al. J Exp Med. 2006 Nov 27;203(12):2779. doi: 10.1084/jem.2002088173106c. Epub 2006 Oct 30. J Exp Med. 2006. PMID: 17074927 Free PMC article. No abstract available.

Abstract

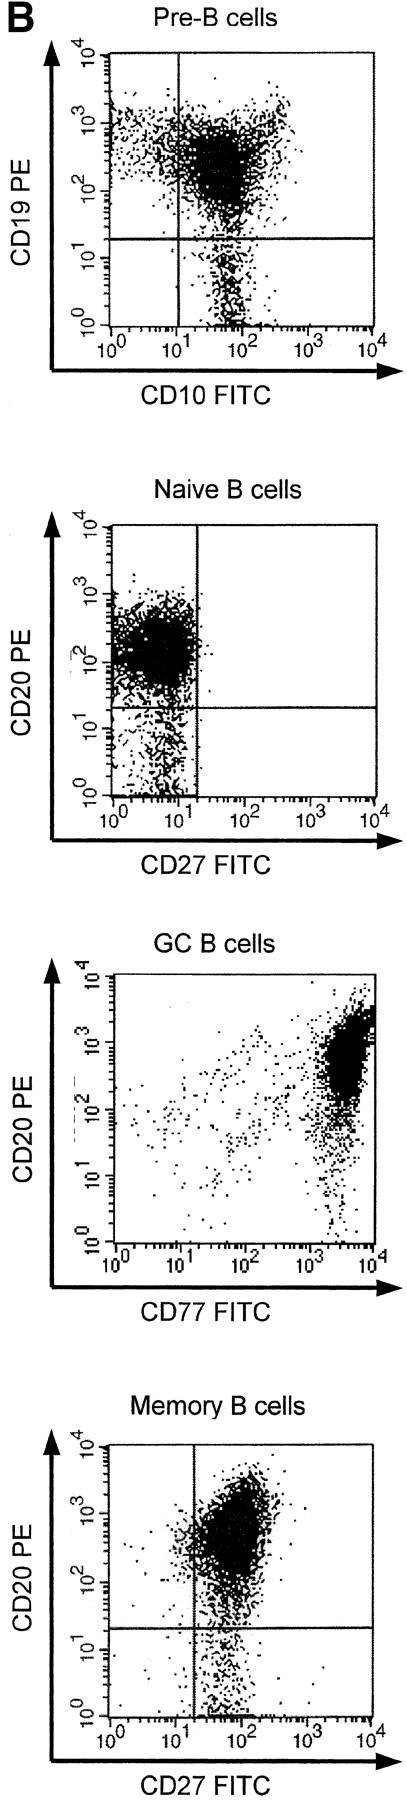
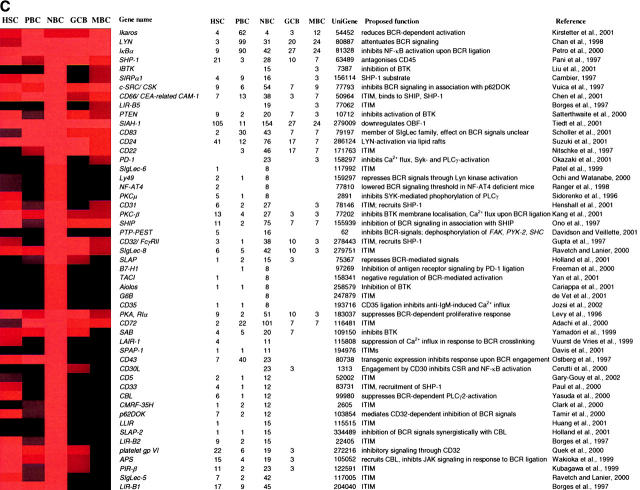
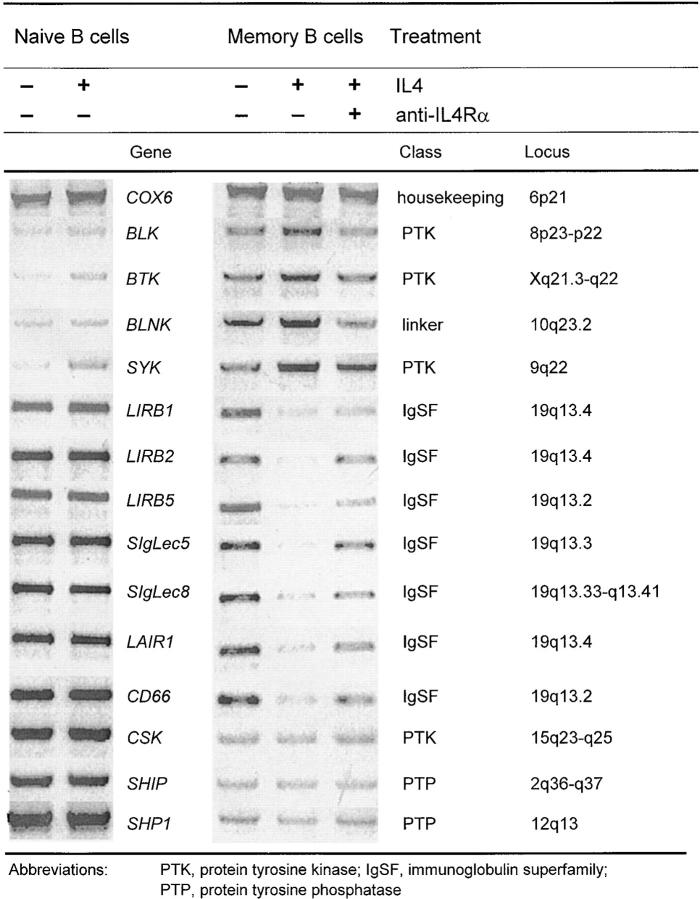
To identify changes in the regulation of B cell receptor (BCR) signals during the development of human B cells, we generated genome-wide gene expression profiles using the serial analysis of gene expression (SAGE) technique for CD34(+) hematopoietic stem cells (HSCs), pre-B cells, naive, germinal center (GC), and memory B cells. Comparing these SAGE profiles, genes encoding positive regulators of BCR signaling were expressed at consistently lower levels in naive B cells than in all other B cell subsets. Conversely, a large group of inhibitory signaling molecules, mostly belonging to the immunoglobulin superfamily (IgSF), were specifically or predominantly expressed in naive B cells. The quantitative differences observed by SAGE were corroborated by semiquantitative reverse transcription-polymerase chain reaction (RT-PCR) and flow cytometry. In a functional assay, we show that down-regulation of inhibitory IgSF receptors and increased responsiveness to BCR stimulation in memory as compared with naive B cells at least partly results from interleukin (IL)-4 receptor signaling. Conversely, activation or impairment of the inhibitory IgSF receptor LIRB1 affected BCR-dependent Ca(2+) mobilization only in naive but not memory B cells. Thus, LIRB1 and IL-4 may represent components of two nonoverlapping gene expression programs in naive and memory B cells, respectively: in naive B cells, a large group of inhibitory IgSF receptors can elevate the BCR signaling threshold to prevent these cells from premature activation and clonal expansion before GC-dependent affinity maturation. In memory B cells, facilitated responsiveness upon reencounter of the immunizing antigen may result from amplification of BCR signals at virtually all levels of signal transduction.


Figures

Figure 1.
Figure 1.
Genotype and phenotype of purified B cell subsets. Bone marrow pre-B cells (CD10+ CD19+), peripheral blood naive B cells (CD19+ CD27), tonsillar GC B cells (CD20+ CD77+), and peripheral blood memory B cells (CD19+ CD27+) were purified as described in Materials and Methods. The mRNA expression of Cμ, Cγ1, Cκ, and VpreB was analyzed by semiquantitative RT-PCR analysis (A). The identity of the purified subsets was further verified by flow cytometry (B): FACS® plots for preB cells (CD10+ CD19+), naive (CD20+ CD27), GC (CD20+ CD77+), and memory B cells (CD20+ CD27+; from top to bottom) are given.
Figure 1.
Figure 1.
Genotype and phenotype of purified B cell subsets. Bone marrow pre-B cells (CD10+ CD19+), peripheral blood naive B cells (CD19+ CD27), tonsillar GC B cells (CD20+ CD77+), and peripheral blood memory B cells (CD19+ CD27+) were purified as described in Materials and Methods. The mRNA expression of Cμ, Cγ1, Cκ, and VpreB was analyzed by semiquantitative RT-PCR analysis (A). The identity of the purified subsets was further verified by flow cytometry (B): FACS® plots for preB cells (CD10+ CD19+), naive (CD20+ CD27), GC (CD20+ CD77+), and memory B cells (CD20+ CD27+; from top to bottom) are given.
Figure 2.
Figure 2.
Cluster analysis of activating and inhibitory B cell receptor signaling molecules. In a systematic survey of PubMed, UniGene and OMIM databases, 211 BCR-related genes were identified, 148 of which could be retrieved from at least one of the SAGE libraries for CD34+ HSC (HSC), pre-B cells (PBC), naive B cells (NBC), GC B cells (GCB), and memory B cells (MBC). In total, 97 activating (A and B) and 51 inhibitory (C) signaling molecules were identified the five SAGE libraries and listed with their gene names, SAGE tag counts for each library, UniGene ID, a brief description of their putative function including a reference. It should be noted that because of limited space in many cases only one functional aspect among others has been included. The SAGE data were sorted based on the ratio of tag counts in memory and naive B cells. For calculation of ratios, a tag count of 0 was set to 0.5. For graphic representation of SAGE data, tag counts have been transformed using the Cluster and Treeview softwares by M.B. Eisen, in which red denotes strong and black no or low expression.
Figure 2.
Figure 2.
Cluster analysis of activating and inhibitory B cell receptor signaling molecules. In a systematic survey of PubMed, UniGene and OMIM databases, 211 BCR-related genes were identified, 148 of which could be retrieved from at least one of the SAGE libraries for CD34+ HSC (HSC), pre-B cells (PBC), naive B cells (NBC), GC B cells (GCB), and memory B cells (MBC). In total, 97 activating (A and B) and 51 inhibitory (C) signaling molecules were identified the five SAGE libraries and listed with their gene names, SAGE tag counts for each library, UniGene ID, a brief description of their putative function including a reference. It should be noted that because of limited space in many cases only one functional aspect among others has been included. The SAGE data were sorted based on the ratio of tag counts in memory and naive B cells. For calculation of ratios, a tag count of 0 was set to 0.5. For graphic representation of SAGE data, tag counts have been transformed using the Cluster and Treeview softwares by M.B. Eisen, in which red denotes strong and black no or low expression.
Figure 3.
Figure 3.
Assessment of quantitative accuracy of SAGE data by RT-PCR. To corroborate quantitative differences of gene expression in naive and memory B cells as observed by SAGE, semiquantitative RT-PCR analysis was performed for 41 selected genes coding for 22 known positive (top) and 19 negative (bottom) regulatory molecules of BCR-dependent activation signals. RT-PCR was performed for 20, 24, 28, and 32 cycles. The amounts of cDNA were comparable for naive and memory B cells as determined by photometry and RT-PCR analysis of the COX6B (cytochrome c oxidase subunit VI) and B2M (β2-microglobulin) genes. For all 41 genes tested, the amount of the amplification product roughly reflects the quantitative distribution of SAGE tags in the libraries for naive and memory B cells. In some instances, no SAGE tag was detected for a given gene. However, in all these cases, an RT-PCR product was obtained at least after 28 cycles of amplification, which indicates that sensitivity of SAGE for low abundance-class genes is inferior to that of RT-PCR.
Figure 4.
Figure 4.
FACS® analysis of costimulatory and inhibitory receptor molecules. To assess whether quantitative differences in mRNA expression as assessed by SAGE and RT-PCR also translate into protein, the surface expression of 10 costimulatory (top) and 10 inhibitory (bottom) surface molecules was analyzed by flow cytometry. Histograms for the expression of surface molecules, whose differential expression was identified by SAGE, are shown for naive (top panel) and memory (bottom panel) B cells. Numbers indicate the tag counts in 100,000 tags in the respective SAGE library.
Figure 4.
Figure 4.
FACS® analysis of costimulatory and inhibitory receptor molecules. To assess whether quantitative differences in mRNA expression as assessed by SAGE and RT-PCR also translate into protein, the surface expression of 10 costimulatory (top) and 10 inhibitory (bottom) surface molecules was analyzed by flow cytometry. Histograms for the expression of surface molecules, whose differential expression was identified by SAGE, are shown for naive (top panel) and memory (bottom panel) B cells. Numbers indicate the tag counts in 100,000 tags in the respective SAGE library.
Figure 5.
Figure 5.
Regulation of inhibitory IgSF receptors in memory B cells by IL-4. Naive and memory B cells were purified from peripheral blood and cultured either in medium alone, or with IL-4. In another set of experiments, memory B cells were cultured in the presence of a neutralizing anti–IL-4Rα antibody, which was added after 8 h of preincubation with IL-4. The left and center panels show amplification products of semiquantitative RT-PCR for positive regulatory PTKs (BLK, BTK, SYK), the linker molecule BLNK, the negative regulatory PTK CSK, the inhibitory PTPs SHIP and SHP1, and the inhibitory IgSF receptors LIRB1, LIRB2, LIRB5, SIgLec5, SIgLec8, and CD66. In the right panel, the genomic loci of these genes are indicated.
Figure 6.
Figure 6.
Regulation of BCR-dependent Ca2+ mobilization by LIRB1 and IL-4 in naive and memory B cells. Naive (A) and memory (B) B cells (B) were preincubated for 24 h in medium, which had been conditioned by LPS-stimulated PBMCs, in the presence of either an antagonistic (light gray curve, αLIRB1 HP-F1) or an agonistic antibody to LIRB1 cross-linked by goat anti–mouse IgG serum (dark gray curve, αLIRB1 GVI/ 75-GAM) or no antibody (black curve, none). Naive and memory B cells were stimulated with anti–human IgM F(ab′)2 and anti–human IgG + IgM F(ab′)2 fragments, respectively, at the indicated times (arrows) and changes of intracellular Ca2+ concentrations in response to BCR engagement were measured by confocal microscopy. In another set of experiments (C), memory B cells were cultured in supernatants from LPS-stimulated PBMCs for 24 h in the presence of human recombinant IL-4 (light gray curve, IL-4), an inhibitory anti–IL-4Rα antibody (dark gray curve, αIL-4Rα) or no further reagents (black curve, none). For each experiment, cells from four donors were purified and separately analyzed, yielding similar results. For quantitation, area under curve (AUC) values were calculated. Statistically significant differences from controls (black curves; none) with P < 0.05 were determined using Fisher's exact test and indicated by asterisks.

References

    1. Rajewsky, K. 1996. Clonal selection and learning in the antibody system. Nature. 381:751–758. - PubMed
    1. Lam, K.P., R. Kühn, and K. Rajewsky. 1997. In vivo ablation of surface immunoglobulin on mature B cells by inducible gene targeting results in rapid cell death. Cell. 90:1073–1083. - PubMed
    1. Kurosaki, T. 1999. Genetic analysis of B cell antigen receptor signaling. Annu. Rev. Immunol. 17:555–592. - PubMed
    1. Tarakhovsky, A., M. Turner, S. Schaal, P.J. Mee, L.P. Duddy, K. Rajewsky, and V.L. Tybulewicz. 1995. Defective antigen receptor-mediated proliferation of B and T cells in the absence of VAV. Nature. 374:467–470. - PubMed
    1. Ravetch, J.V., and L.L. Lanier. 2000. Immune inhibitory receptors. Science. 290:84–89. - PubMed

Publication types

MeSH terms