. 2002 Nov 18;196(10):1307-19.
doi: 10.1084/jem.20021031.

Mouse plasmacytoid cells: long-lived cells, heterogeneous in surface phenotype and function, that differentiate into CD8(+) dendritic cells only after microbial stimulus

Affiliations

Mouse plasmacytoid cells: long-lived cells, heterogeneous in surface phenotype and function, that differentiate into CD8(+) dendritic cells only after microbial stimulus

Meredith O'Keeffe et al. J Exp Med. .

Abstract

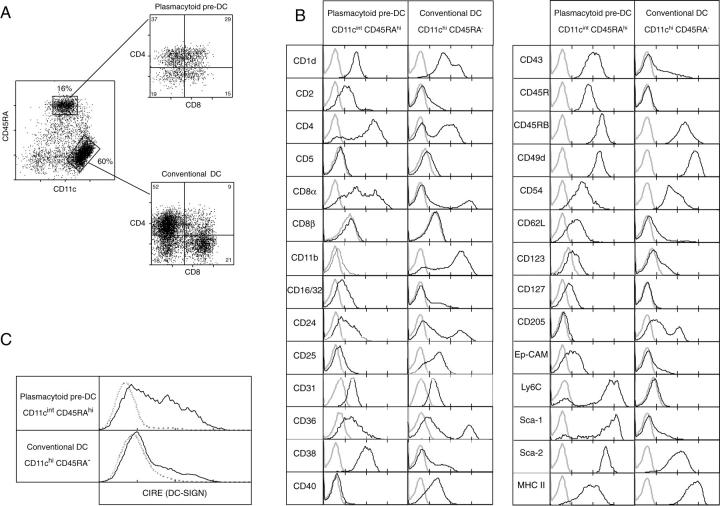
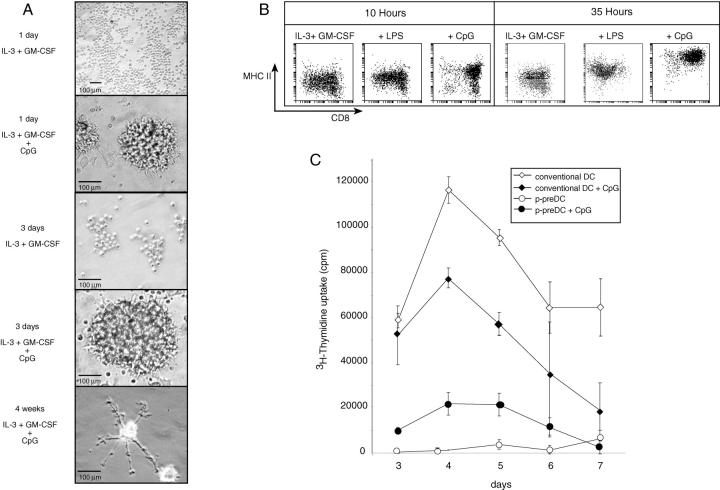
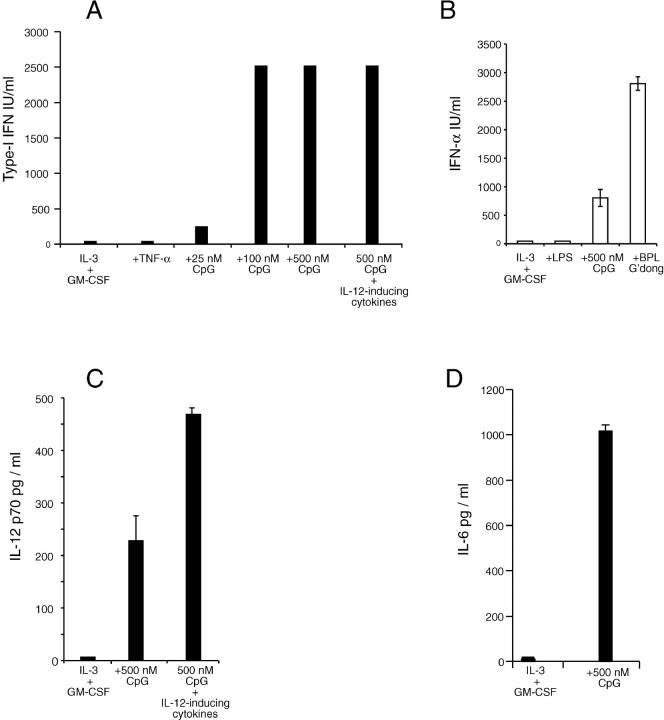
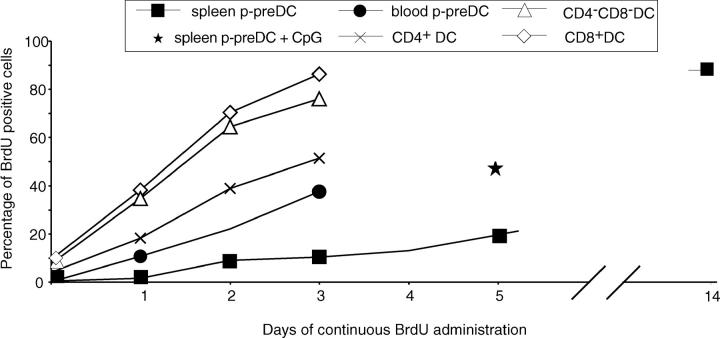
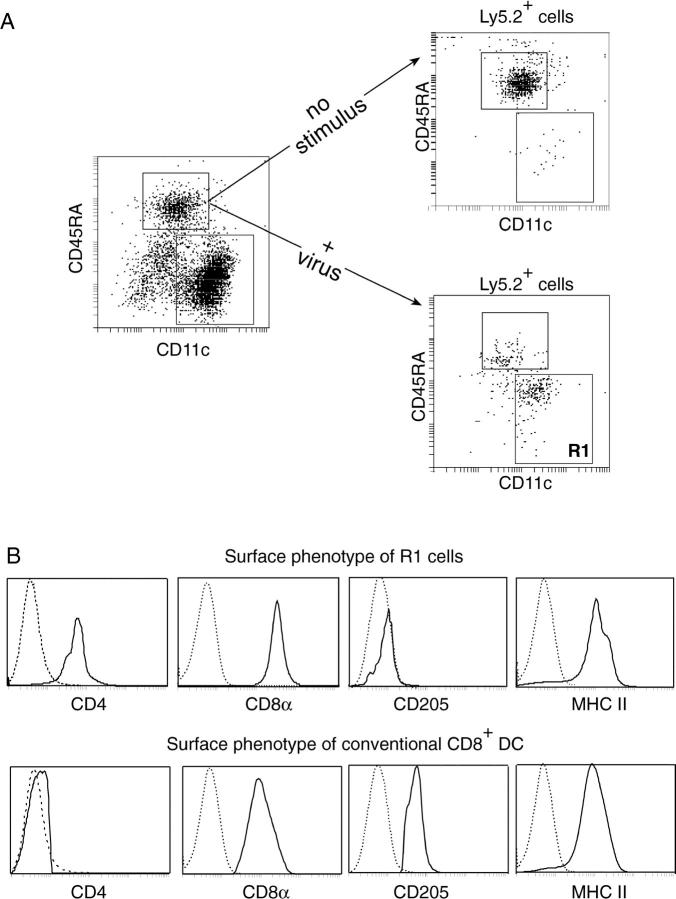
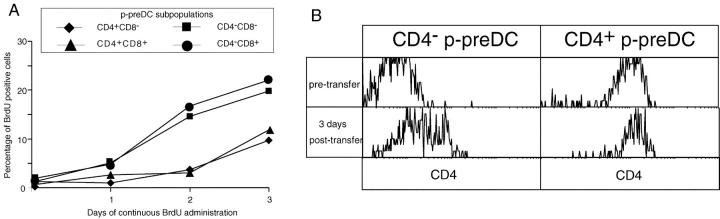
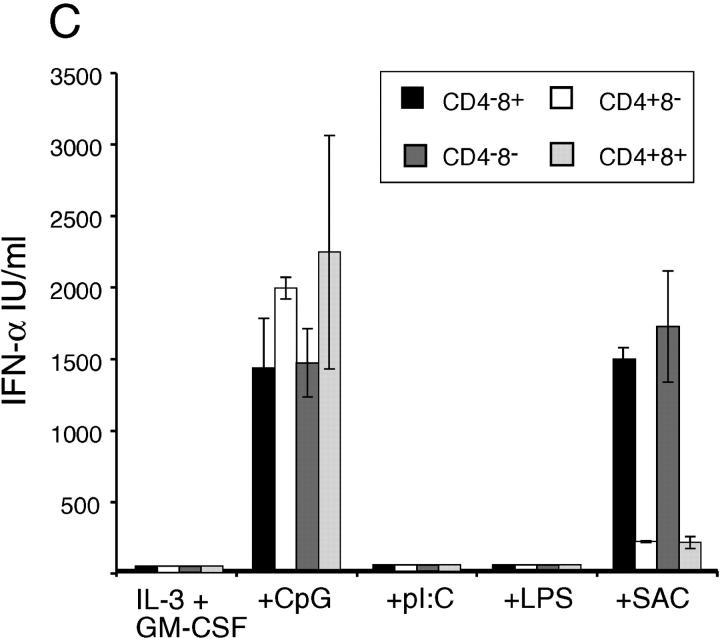
The CD45RA(hi)CD11c(int) plasmacytoid predendritic cells (p-preDCs) of mouse lymphoid organs, when stimulated in culture with CpG or influenza virus, produce large amounts of type I interferons and transform without division into CD8(+)CD205(-) DCs. P-preDCs express CIRE, the murine equivalent of DC-specific intercellular adhesion molecule 3 grabbing nonintegrin (DC-SIGN). P-preDCs are divisible by CD4 expression into two subgroups differing in turnover rate and in response to Staphylococcus aureus. The kinetics of bromodeoxyuridine labeling and the results of transfer to normal recipient mice indicate that CD4(-) p-preDCs are the immediate precursors of CD4(+) p-preDCs. Similar experiments indicate that p-preDCs are normally long lived and are not the precursors of the short-lived steady-state conventional DCs. However, in line with the culture studies on transfer to influenza virus-stimulated mice the p-preDCs transform into CD8(+)CD205(-) DCs, distinct from conventional CD8(+)CD205(+) DCs. Hence as well as activating preexistant DCs, microbial infection induces a wave of production of a new DC subtype. The functional implications of this shift in the DC network remain to be determined.


Figures

Figure 1.
Figure 1.
Surface phenotype of mouse spleen p-preDCs compared with conventional DCs. Mouse spleen p-preDCs and conventional DCs were purified as described in Materials and Methods. The enriched preparation, after removal of autofluorescent cells, was stained for surface expression of CD11c and CD45RA, together with staining for one or two other surface molecules. The p-preDCs (CD45RAhiCD11cint) and DCs (CD45RACD11chi) populations were gated as shown in A. The distribution of CD4 and CD8 on these (gated) populations is shown as a dot plot in A and as histograms in B. The fluorescence distributions of a range of surface markers on the p-preDCs and conventional DC populations are shown in B; the broken lines give the background fluorescence with only the relevant stain omitted. Not shown are the stains for the following surface molecules that were negative (like CD40, as shown) on the preDC populations: 41BBLigand, CD14, CD18, CD19, CD80, CD86, CD115, NK cell marker (DX-5). Surface staining for CIRE, the putative mouse DC-SIGN homologue is shown in C. The data of A are representative of more than 10 analyses, the data of B and C are representative of 2–5 analyses.
Figure 2.
Figure 2.
Phenotype of p-preDCs after culture. (A) Images of p-preDCs after 1 d, 3 d, or 4 wk culture in the presence of IL-3 and GM-CSF, with or without CpG. Many cells died in the long term stimulated cultures, the results at 4 wk representing surviving cells. The original magnification was ×20 (top panel) and ×40 (all other panels). The images are representative of cultures from more than 20 preparations of sorted p-preDCs. (B) The MHC II and CD8α surface phenotype of cells after 10 h culture of sorted spleen p-preDCs in IL-3 and GM-CSF alone, or together with LPS or CPG, is shown, along with the phenotype of sorted p-preDCs after 35 h culture with IL-3 and GM-CSF alone, or together with LPS or CPG. The analyses are representative of more than 10 similar experiments. The recoveries of cells are indicated in Table I. (C) The ability of 2 × 10³ p-preDCs to stimulate 2 × 10⁴ CBA CD4+ T cells in an MLR in the presence or absence of CpG. The stimulatory capacity of p-preDCs was compared with that of 2 × 10³ conventional DCs (purified at the same time), in the presence or absence of CpG. The average cpm of triplicate values is shown for each time point, the error bars representing the range of triplicate values. The data shown are from a single experiment; similar results were obtained in a second experiment.
Figure 3.
Figure 3.
Activated spleen p-preDC produce IFN-α, IL-12, and IL-6. (A) Bioassay for the production of type I IFN from p-preDCs cultured for 14 h with IL-3 and GM-CSF alone, or with additional cytokines and stimulants. The “IL-12 inducing cytokines” were IL-3, GM-CSF, rat IFN-γ, and IL-4. The values shown represent the means of duplicate samples; similar results were obtained in three separate experiments. Culturing of p-preDCs for up to 80 h yielded similar supernatant levels of type I IFN. The production of type I IFN from p-preDCs stimulated with BPL-Guangdong and live Guangdong virus was also shown by bioassay in a single experiment; the levels being higher than with CpG. (B) ELISA for the production of IFN-α from p-preDCs cultured for 14 h in the presence of IL-3 and GM-CSF together with the stimulants shown. The results shown were similar to those obtained in three separate experiments for LPS and BPL-Guangdong and in five separate experiments for IL-3 and GM-CSF with or without CpG. The values shown are the means of duplicate samples and the error bars represent the range. (C) ELISA for the production of IL-12 p70 from spleen p-preDCs cultured for 14 h with IL-3 and GM-CSF alone, or together with additional cytokines and stimulants. IL-12 inducing cytokines were IL-3, GM-CSF, rat IFN-γ, and IL-4. The values shown are the means of duplicate samples and the error bars represent the range; similar results were obtained in three separate experiments. (D) ELISA for the production of IL-6 from spleen p-preDCs cultured for 14 h with IL-3 and GM-CSF alone, or together with CpG. The values shown are the means of duplicate samples and the error bars represent the range; similar results were obtained in three separate experiments.
Figure 4.
Figure 4.
Spleen p-preDCs are long-lived cells compared with the short-lived spleen DCs. BrdU was continuously administered to normal, unstimulated, uninfected mice and at times from 2 h (the first time point) to 14 d of labeling, spleen p-preDCs and conventional DCs were isolated, stained for surface markers to delineate the subsets and stained for intra-cellular BrdU to determine their BrdU-labeling kinetics. The labeling of the three splenic conventional DC subsets is compared with that of the total splenic p-preDCs and total blood p-preDCs; a single 5 d point compares the labeling of spleen p-preDCs from mice injected once with CpG (0.3 μmol) at time zero. Results are the mean values from two separate experiments, giving similar results, except for the CpG and 14 d points which represent a single experiment.
Figure 5.
Figure 5.
Mouse p-preDCs do not generate DCs on transfer to an unstimulated recipient, but generate CD8+ DCs on transfer to an influenza virus-injected recipient. Ly5.2+CD11cintCD45RA+ p-preDCs (106) were intravenously transferred to Ly5.1+ recipient mice that received either no stimulus or a single intravenous dose of 400 HAU of BPL-Guangdong virus 2 h after cell transfer. 12 h after cell transfer the p-preDCs and conventional DCs were purified from the recipient mice and autofluorescent cells were removed by presorting. (A) The p-preDCs and conventional DCs were stained with antibodies to Ly5.2, CD11c, and CD45RA. The surface phenotypes of the gated Ly5.2+ cells from mice that received either no stimulus or inactivated virus are compared. (B) After virus treatment many of the Ly5.2+ cells displayed a changed phenotype (Region 1(R1) cells). The surface phenotypes of the donor-derived R1 cells and host conventional CD8+ DCs, both from mice that received inactivated virus, were compared. The cells were stained with antibodies against the following markers: Ly5.2, CD45RA, and CD11c, together with CD8 or CD205 or MHC II or CD4. R1 cells were gated as in panel A. Host conventional CD8+ DCs were gated as CD11c+CD45RA cells expressing either CD8 or CD205, although for MHC II staining these cells were gated as CD11c+CD45RA only since the level of MHC II was the same on all of the conventional DCs within this gate. The broken lines give the background fluorescence with only the relevant stain omitted. Similar results were obtained in five experiments for the transfer of p-preDCs into hosts that received no stimulus. Similar results were obtained in two experiments for the transfer of p-preDCs into hosts that received 400 HAU of BPL-Guangdong virus and in a third experiment where hosts received 400 HAU of BPL-PR/8/34 virus.
Figure 6.
Figure 6.
Spleen p-preDCs subsets differ in function and developmental kinetics. (A) BrdU-labeling was performed as in Fig. 4 and p-preDCs were divided into subsets based on CD4 and CD8 expression. Results are the mean values from two separate experiments, giving similar results. (B) Sorted CD4+ or CD4 p-preDCs were transferred to Ly5.1+ mice (without stimulus) as in Fig. 5. 3 d later conventional and p-preDC subsets were harvested and cells were stained with antibodies against the following markers: Ly5.2, CD4, CD45RA, and CD11c. Cells were gated based on high Ly5.2 expression and the CD4 expression level on these cells is shown. All Ly5.2+ cells from both sets of mice had maintained the original phenotype CD11cintCD45RAhi. (C) Spleen p-preDCs sorted on the basis of CD4 and CD8 expression into four subsets, then cultured for 36 h in the presence of IL-3 and GM-CSF alone or together with 500 nM CpG, 100 μg/ml poly I:C, 10 μg/ml LPS, or 10 μg/ml SAC. The cell supernatants were tested by ELISA for the production of IFN-α. The values shown are the means of duplicate samples and the error bars represent the range of these samples; similar results were obtained in three separate experiments.
Figure 6.
Figure 6.
Spleen p-preDCs subsets differ in function and developmental kinetics. (A) BrdU-labeling was performed as in Fig. 4 and p-preDCs were divided into subsets based on CD4 and CD8 expression. Results are the mean values from two separate experiments, giving similar results. (B) Sorted CD4+ or CD4 p-preDCs were transferred to Ly5.1+ mice (without stimulus) as in Fig. 5. 3 d later conventional and p-preDC subsets were harvested and cells were stained with antibodies against the following markers: Ly5.2, CD4, CD45RA, and CD11c. Cells were gated based on high Ly5.2 expression and the CD4 expression level on these cells is shown. All Ly5.2+ cells from both sets of mice had maintained the original phenotype CD11cintCD45RAhi. (C) Spleen p-preDCs sorted on the basis of CD4 and CD8 expression into four subsets, then cultured for 36 h in the presence of IL-3 and GM-CSF alone or together with 500 nM CpG, 100 μg/ml poly I:C, 10 μg/ml LPS, or 10 μg/ml SAC. The cell supernatants were tested by ELISA for the production of IFN-α. The values shown are the means of duplicate samples and the error bars represent the range of these samples; similar results were obtained in three separate experiments.

Similar articles

Cited by

References

    1. Eckert, F., and U. Schmid. 1989. Identification of plasmacytoid T cells in lymphoid hyperplasia of the skin. Arch. Dermatol. 125:1518–1524. - PubMed
    1. Grouard, G., M.C. Rissoan, L. Filgueira, I. Durand, J. Banchereau, and Y.J. Liu. 1997. The enigmatic plasmacytoid T cells develop into dendritic cells with interleukin (IL)-3 and CD40-ligand. J. Exp. Med. 185:1101–1111. - PMC - PubMed
    1. Siegal, F.P., N. Kadowaki, M. Shodell, P.A. Fitzgerald-Bocarsly, K. Shah, S. Ho, S. Antonenko, and Y.J. Liu. 1999. The nature of the principal type 1 interferon-producing cells in human blood. Science. 284:1835–1837. - PubMed
    1. Cella, M., D. Jarrossay, F. Facchetti, O. Alebardi, H. Nakajima, A. Lanzavecchia, and M. Colonna. 1999. Plasmacytoid monocytes migrate to inflamed lymph nodes and produce large amounts of type I interferon. Nat. Med. 5:919–923. - PubMed
    1. Cella, M., F. Facchetti, A. Lanzavecchia, and M. Colonna. 2000. Plasmacytoid dendritic cells activated by influenza virus and CD40L drive a potent TH1 polarization. Nat. Immunol. 1:305–310. - PubMed