. 2002 Nov 18;196(10):1321-33.
doi: 10.1084/jem.20012135.

Recipient iNOS but not eNOS deficiency reduces luminal narrowing in tracheal allografts

Affiliations

Recipient iNOS but not eNOS deficiency reduces luminal narrowing in tracheal allografts

Kanji Minamoto et al. J Exp Med. .

Abstract

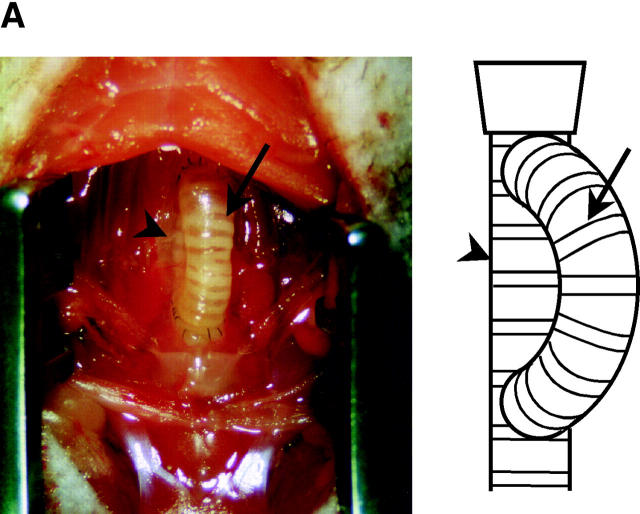
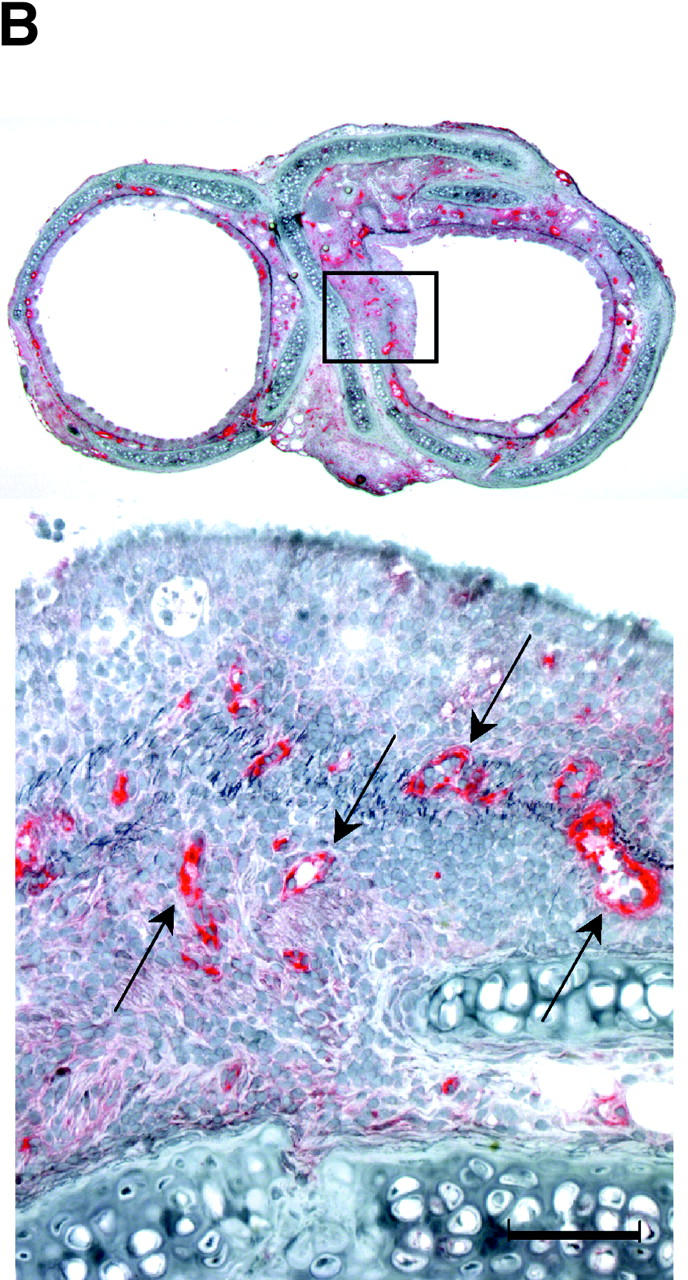
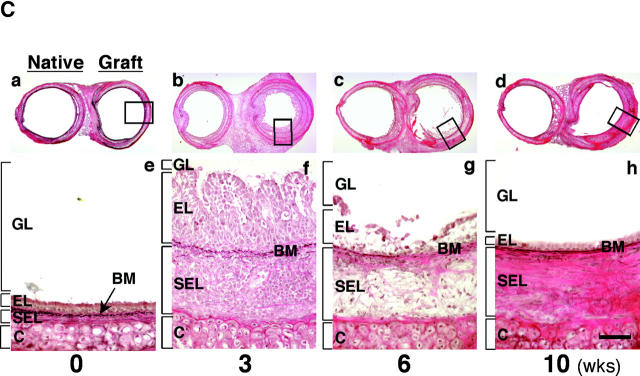
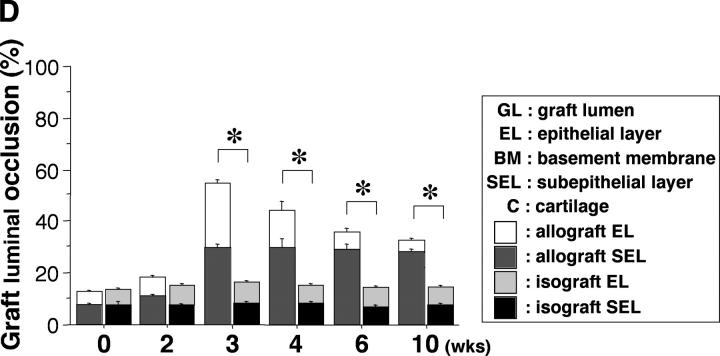
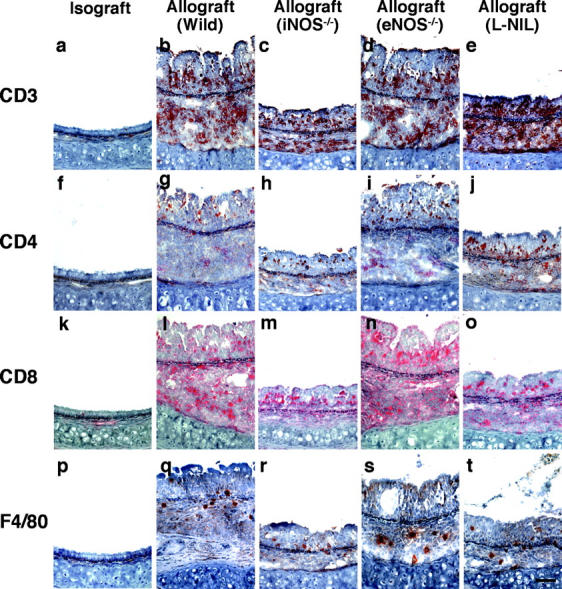
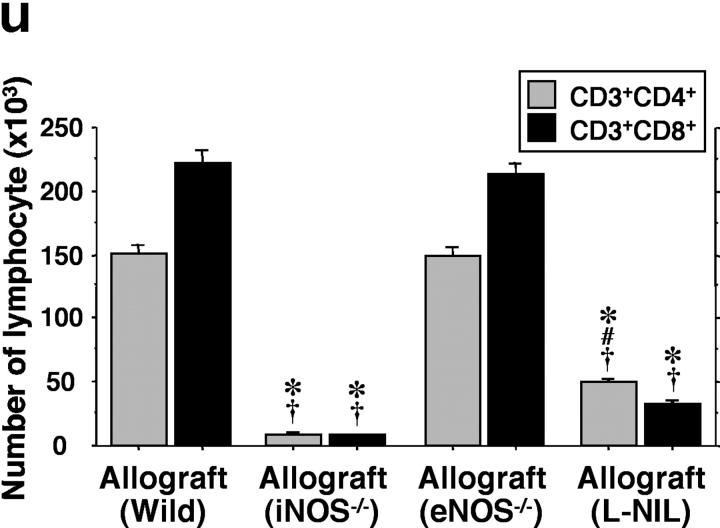
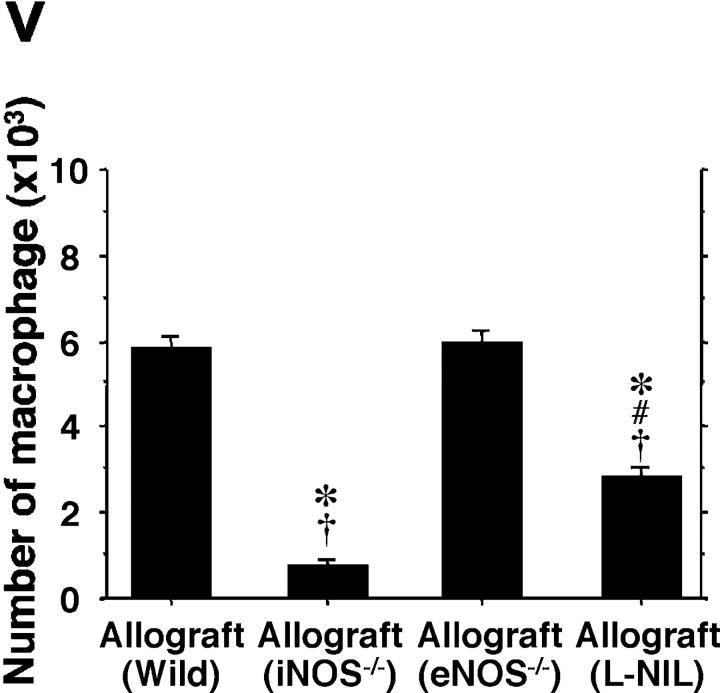
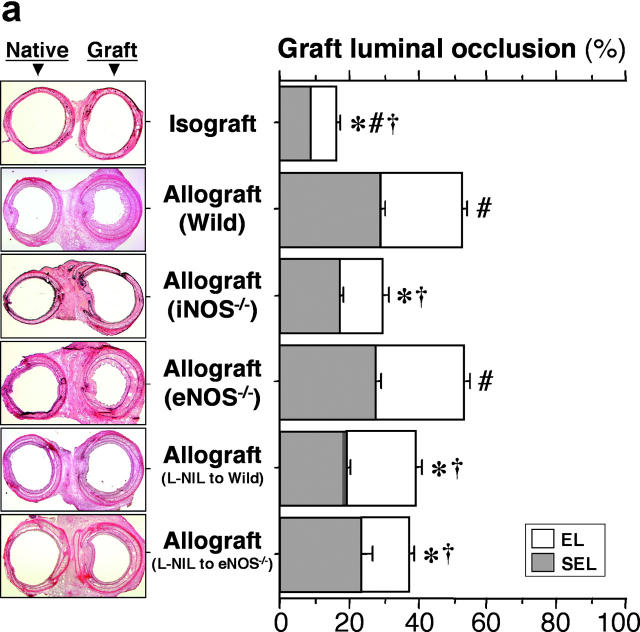
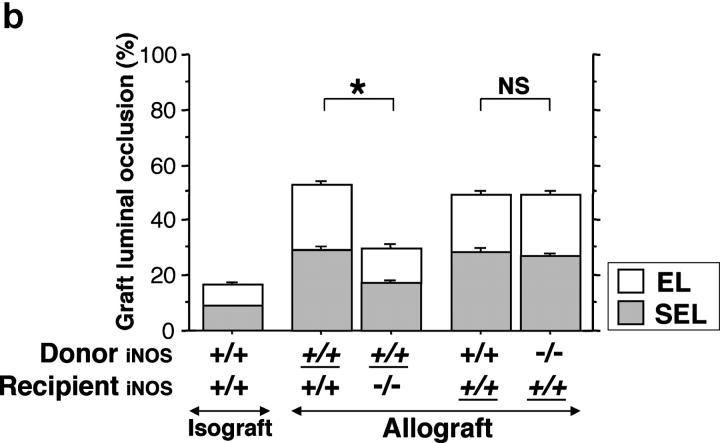
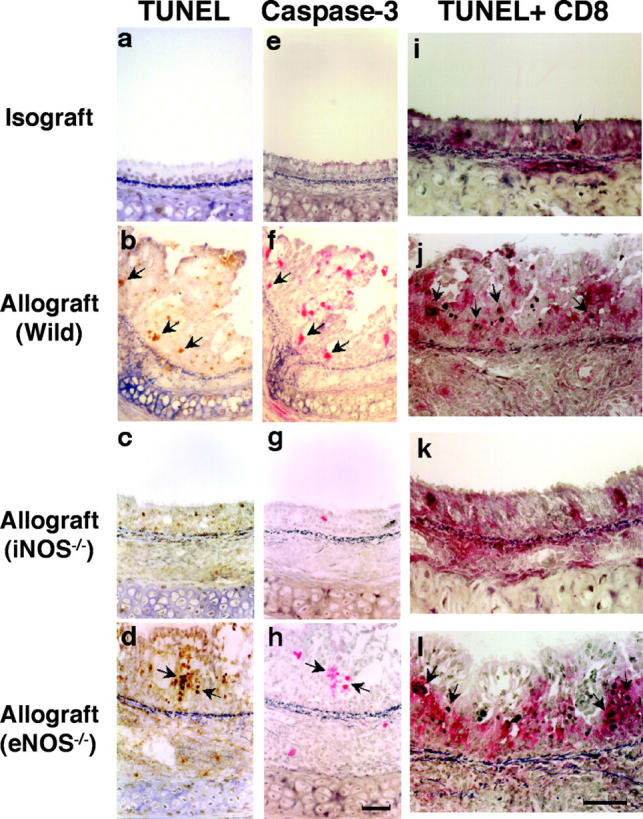
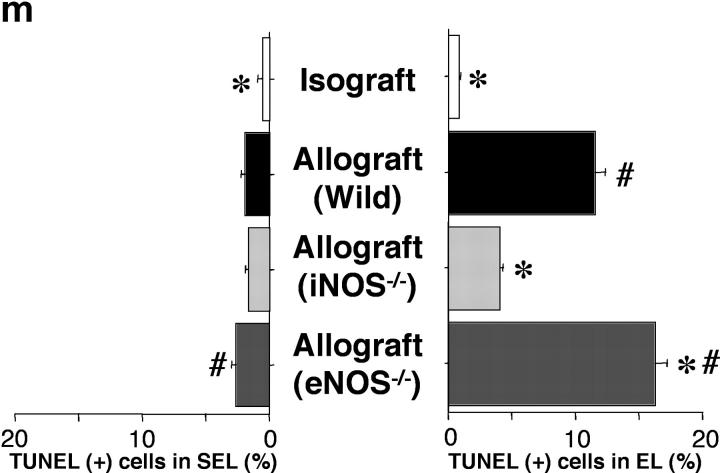
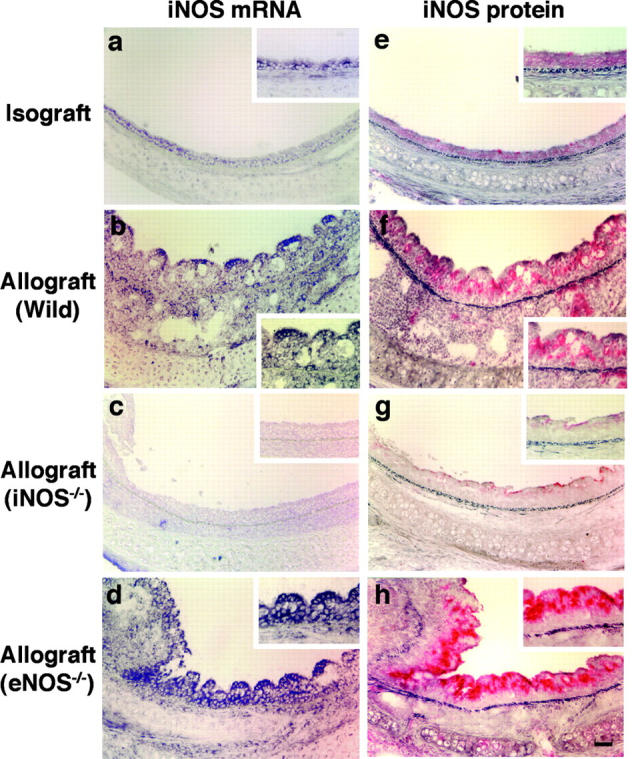
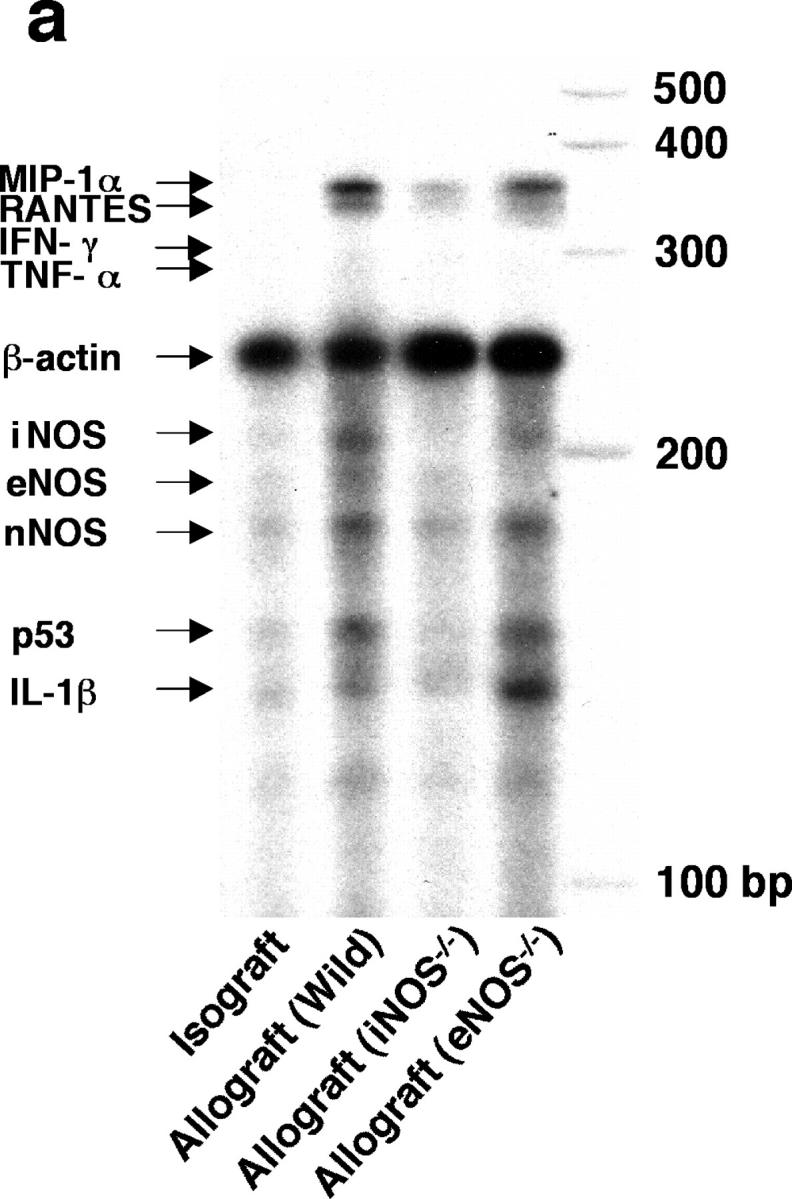
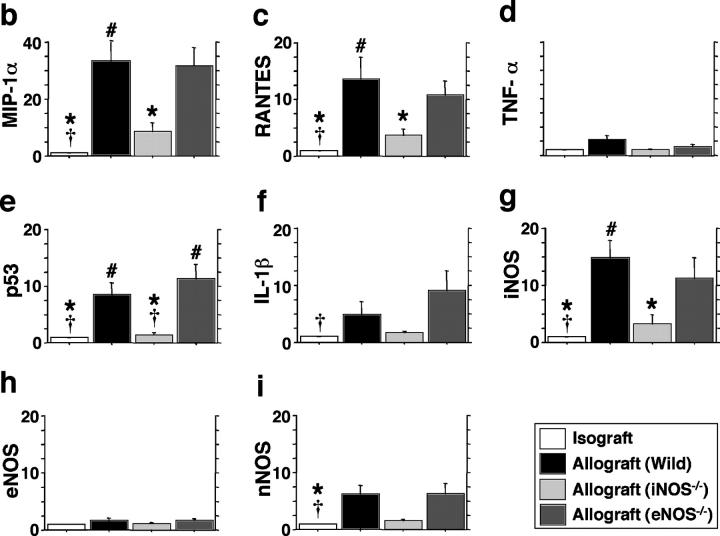
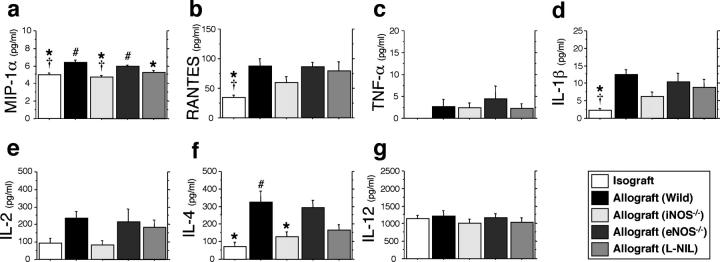
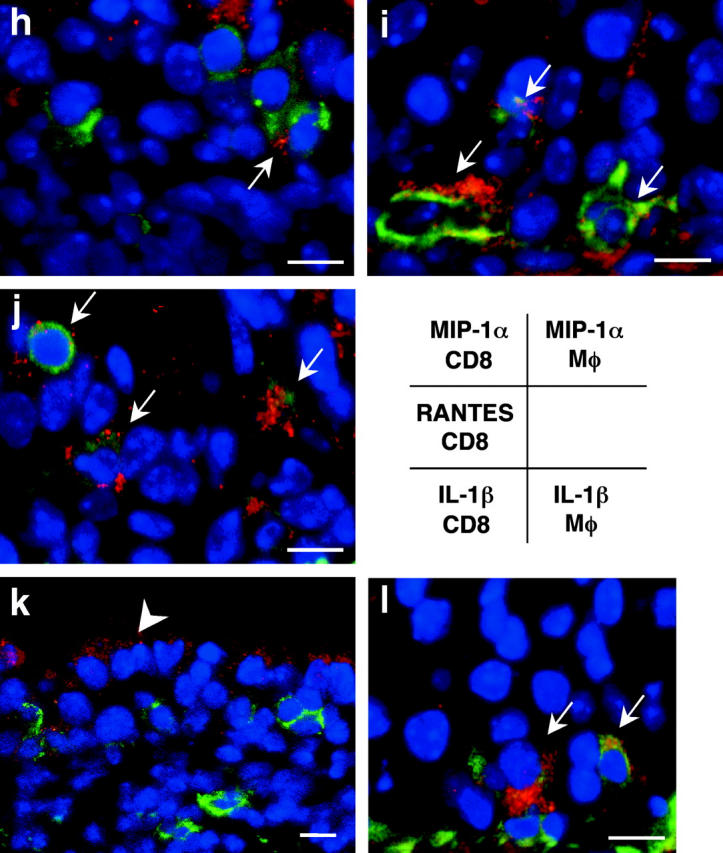
Chronic airway rejection is characterized by prolonged inflammation, epithelial damage, and eventual luminal obliterative bronchiolitis (OB). In cardiac allografts, the inducible nitric oxide synthase (iNOS) promotes acute rejection but paradoxically reduces neointimal formation, the hallmark of chronic rejection. The specific roles of NOS isoforms in modulating lymphocyte traffic and airway rejection are not known. Using a double lumen mouse tracheal transplant model, tracheal grafts from B10.A (allo) or C57BL/6J (iso) mice were transplanted into cyclosporine-treated wild-type (WT) iNOS(-/-) or endothelial NOS (eNOS)(-/-) recipients. OB was observed in WT tracheal allografts at 3 weeks (53 +/- 2% luminal occlusion vs. 17 +/- 1% for isografts, P < 0.05) with sites of obstructive lesion formation coinciding with areas of CD3(+) CD8(+) T cell-rich lymphocytic bronchitis. In contrast, allografts in iNOS(-/-) recipients exhibited reductions in local expression of proinflammatory chemokines and cytokines, graft T cell recruitment and apoptosis, and luminal obliteration (29 +/- 2%, P < 0.05 vs. WT allografts). Recipient eNOS deficiency, however, suppressed neither chemokine expression, lymphocyte infiltration, nor airway occlusion (54 +/- 2%). These data demonstrate that iNOS exacerbates luminal obliteration of airway allografts in contrast with the known suppression by iNOS of cardiac allograft vasculopathy. Because iNOS(-/-) airways transplanted into WT allograft hosts are not protected from rejection, these data suggest that iNOS expressed by graft-infiltrating leukocytes exerts the dominant influence on airway rejection.


Figures

Figure 1.
Figure 1.
(A) New model of murine tracheal transplantation. The graft can fulfill its function as an airway by placing the proximal and distal graft anastomoses in the native trachea. This environment allows epithelium in the graft to be exposed to air and drain mucous through the anastomosis. Arrow, tracheal graft; arrowhead, native trachea. (B) Immunostaining for vWf in an allograft from a WT recipient. Arrows, anti–vWf-reactive capillaries. (C) Representative Verhoeff's-Van Gieson staining of transverse sections (low power magnification for a–d, high power magnification for e–h) through WT allografts (right side) with native trachea (left side) revealing the time course of the rejection process. After tracheal transplant (0 wk; a and e), mononuclear cells accumulated in the EL as well as SEL at 3 wk (b and f), with subsequent diminution by 6 wk (c and g). After 6 wk, epithelial cells were observed to dissociate from the basement membrane (BM). By 10 wk (d and h), epithelium appeared flattened with loss of ciliary structures and the subepithelial space was thickened with substantial collagen deposition. The time course of luminal occlusive lesions in the EL and SEL shown in D demonstrates that the intensity of the infiltrate corresponds with subsequent graft luminal (GL) occlusion. Comparing luminal patency with isografts, which exhibited near-complete patency, allografts were maximally occluded 3 wk after transplantation. n = 4 for each group; *, P < 0.05; bar, 50 μm.
Figure 1.
Figure 1.
(A) New model of murine tracheal transplantation. The graft can fulfill its function as an airway by placing the proximal and distal graft anastomoses in the native trachea. This environment allows epithelium in the graft to be exposed to air and drain mucous through the anastomosis. Arrow, tracheal graft; arrowhead, native trachea. (B) Immunostaining for vWf in an allograft from a WT recipient. Arrows, anti–vWf-reactive capillaries. (C) Representative Verhoeff's-Van Gieson staining of transverse sections (low power magnification for a–d, high power magnification for e–h) through WT allografts (right side) with native trachea (left side) revealing the time course of the rejection process. After tracheal transplant (0 wk; a and e), mononuclear cells accumulated in the EL as well as SEL at 3 wk (b and f), with subsequent diminution by 6 wk (c and g). After 6 wk, epithelial cells were observed to dissociate from the basement membrane (BM). By 10 wk (d and h), epithelium appeared flattened with loss of ciliary structures and the subepithelial space was thickened with substantial collagen deposition. The time course of luminal occlusive lesions in the EL and SEL shown in D demonstrates that the intensity of the infiltrate corresponds with subsequent graft luminal (GL) occlusion. Comparing luminal patency with isografts, which exhibited near-complete patency, allografts were maximally occluded 3 wk after transplantation. n = 4 for each group; *, P < 0.05; bar, 50 μm.
Figure 2.
Figure 2.
Immunohistochemical staining of the pan-T cell marker CD3 (a–e; brown), as well as CD4+ (f–j; brown), CD8+ (k–o; red) T cells, and F4/80+ (p–t; brown) macrophages in sections from grafts transplanted into isogeneic (a, f, k, and p), allogeneic WT (b, g, l, and q), iNOS−/− (c, h, m, and r), eNOS−/− (d, i, n, and s) recipients, and L-NIL–treated WT (e, j, o, and t) recipients 3 wk after transplantation. Quantitative analysis of mononuclear cell infiltrates by FACS®, shown as absolute numbers of recovered CD3+ CD4+ and CD3+ CD8+ T cells (u), and F4/80+ macrophages (v) in each graft from each group. Bar, 50 μm; *, P < 0.05 versus allografts from WT recipients; #, P < 0.05 versus allografts from iNOS−/− recipients; †, P < 0.05 versus allografts from eNOS−/− recipients.
Figure 2.
Figure 2.
Immunohistochemical staining of the pan-T cell marker CD3 (a–e; brown), as well as CD4+ (f–j; brown), CD8+ (k–o; red) T cells, and F4/80+ (p–t; brown) macrophages in sections from grafts transplanted into isogeneic (a, f, k, and p), allogeneic WT (b, g, l, and q), iNOS−/− (c, h, m, and r), eNOS−/− (d, i, n, and s) recipients, and L-NIL–treated WT (e, j, o, and t) recipients 3 wk after transplantation. Quantitative analysis of mononuclear cell infiltrates by FACS®, shown as absolute numbers of recovered CD3+ CD4+ and CD3+ CD8+ T cells (u), and F4/80+ macrophages (v) in each graft from each group. Bar, 50 μm; *, P < 0.05 versus allografts from WT recipients; #, P < 0.05 versus allografts from iNOS−/− recipients; †, P < 0.05 versus allografts from eNOS−/− recipients.
Figure 3.
Figure 3.
(a) Analysis of tracheal graft sections 3 wk after transplantation. Representative sections (left) and morphometric analysis of sections (right) for each of the indicated conditions. Isografts were WT and allograft recipients were either WT, iNOS−/−, or eNOS−/−. The effect of pharmacologic recipient iNOS inhibition with L-NIL (5 mg/kg/day for 3 wk after transplantation) in WT and eNOS−/− recipients was also examined. Allografts placed in iNOS−/− or iNOS-inhibited recipients demonstrated significantly reduced luminal obliteration compared with WT and eNOS−/− allograft recipients. In contrast, recipient eNOS deficiency was associated with similar degrees of luminal occlusion as WT allograft recipients. *, P < 0.05 versus allografts from WT recipients; #, P < 0.05 versus allografts from iNOS−/− recipients; †, P < 0.05 versus allografts from eNOS−/− recipients. (b) The effect of epithelial versus leukocyte-derived iNOS on graft luminal occlusion. Donor tissue and recipient genotypes were either iNOS+/+ or iNOS−/−, as indicated. Effect of background strain is also indicated here. Genotypes that are underlined represent B10.A strain background. Genotypes that are not underlined represent C57BL/6J. Note that the leftmost three bars represent the same data as is shown in a, repeated here to facilitate comparison. *, P < 0.05.
Figure 3.
Figure 3.
(a) Analysis of tracheal graft sections 3 wk after transplantation. Representative sections (left) and morphometric analysis of sections (right) for each of the indicated conditions. Isografts were WT and allograft recipients were either WT, iNOS−/−, or eNOS−/−. The effect of pharmacologic recipient iNOS inhibition with L-NIL (5 mg/kg/day for 3 wk after transplantation) in WT and eNOS−/− recipients was also examined. Allografts placed in iNOS−/− or iNOS-inhibited recipients demonstrated significantly reduced luminal obliteration compared with WT and eNOS−/− allograft recipients. In contrast, recipient eNOS deficiency was associated with similar degrees of luminal occlusion as WT allograft recipients. *, P < 0.05 versus allografts from WT recipients; #, P < 0.05 versus allografts from iNOS−/− recipients; †, P < 0.05 versus allografts from eNOS−/− recipients. (b) The effect of epithelial versus leukocyte-derived iNOS on graft luminal occlusion. Donor tissue and recipient genotypes were either iNOS+/+ or iNOS−/−, as indicated. Effect of background strain is also indicated here. Genotypes that are underlined represent B10.A strain background. Genotypes that are not underlined represent C57BL/6J. Note that the leftmost three bars represent the same data as is shown in a, repeated here to facilitate comparison. *, P < 0.05.
Figure 4.
Figure 4.
Apoptotic cells were detected using the in situ TUNEL labeling method (a–d; arrows) and further corroborated immunohistochemically by colocalizing caspase-3 expression in the same cells in adjacent sections (e–h; arrows). Double staining for apoptotic CD8+ T lymphocytes (i–l; arrows) is detected by black nuclear labeling for apoptosis and red cytoplasmic staining for CD8. Apoptosis of CD8+ T lymphocytes (arrows) was most abundant in the EL of allografts placed in WT and eNOS−/− recipients. The graph (m) shows quantitative T lymphocyte apoptotic activity in both the EL and SEL of the graft. Apoptosis of T lymphocytes was reduced by recipient iNOS deficiency. *, P < 0.05 versus allografts from WT recipients; #, P < 0.05 versus allografts from iNOS−/− recipients; bar, 50 μm.
Figure 4.
Figure 4.
Apoptotic cells were detected using the in situ TUNEL labeling method (a–d; arrows) and further corroborated immunohistochemically by colocalizing caspase-3 expression in the same cells in adjacent sections (e–h; arrows). Double staining for apoptotic CD8+ T lymphocytes (i–l; arrows) is detected by black nuclear labeling for apoptosis and red cytoplasmic staining for CD8. Apoptosis of CD8+ T lymphocytes (arrows) was most abundant in the EL of allografts placed in WT and eNOS−/− recipients. The graph (m) shows quantitative T lymphocyte apoptotic activity in both the EL and SEL of the graft. Apoptosis of T lymphocytes was reduced by recipient iNOS deficiency. *, P < 0.05 versus allografts from WT recipients; #, P < 0.05 versus allografts from iNOS−/− recipients; bar, 50 μm.
Figure 5.
Figure 5.
Analysis of iNOS mRNA expression by in situ hybridization and iNOS immunoreactivity in airway grafts. Both iNOS mRNA and protein production are modestly detected in the EL of isografts (a and e), but strongly detected in epithelial cells and inflammatory cells from allografts placed in WT recipients (b and f). Allografts from iNOS−/− recipients exhibited virtually no iNOS mRNA (c) or protein expression, except faint detection observed on the surface of the EL (g). However, elevated iNOS mRNA (d) and strong iNOS immunoreactivity (h) was identified in allografts from eNOS−/− recipients. Bar, 50 μm.
Figure 6.
Figure 6.
Simultaneous quantitation of multiple mRNA species encoding chemokines, proapoptotic mediators, and NOS isoforms in grafts from each group were examined using multiprobe RNase protection assays 3 wk after transplantation (n = 5 for each). 15 μg of total RNA was hybridized to each of the 10 antisense riboprobes (refer to Table I) (a) The intensity of each protected band was determined by densitometry, with values normalized first to the corresponding β actin band and then relative to the normalized value for each isograft experiment (b–i). *, P < 0.05 versus allografts from WT recipients; #, P < 0.05 versus allografts from iNOS−/− recipients; †, P < 0.05 versus allografts from eNOS−/− recipients.
Figure 6.
Figure 6.
Simultaneous quantitation of multiple mRNA species encoding chemokines, proapoptotic mediators, and NOS isoforms in grafts from each group were examined using multiprobe RNase protection assays 3 wk after transplantation (n = 5 for each). 15 μg of total RNA was hybridized to each of the 10 antisense riboprobes (refer to Table I) (a) The intensity of each protected band was determined by densitometry, with values normalized first to the corresponding β actin band and then relative to the normalized value for each isograft experiment (b–i). *, P < 0.05 versus allografts from WT recipients; #, P < 0.05 versus allografts from iNOS−/− recipients; †, P < 0.05 versus allografts from eNOS−/− recipients.
Figure 7.
Figure 7.
Serum cytokine levels measured by ELISA 3 wk after transplantation (n = 10 for each group; a–g.) Colocalization of intracellular chemokine expression (MIP-1α, RANTES, and IL-1β) and leukocyte immunophenotype was determined by confocal microscopic examination using immunofluorescent staining technique (h–l). Intracellular chemokines were identified by red emission after the application of an excitation wavelength of 594 nm. CD8+ T cells (h, j, and k) and F4/80+ macrophages (i and l) were labeled with FITC, which was detected as a green emission after the application of an excitation wavelength of 488 nm. Sites of colocalization (yellow) are indicated by arrows and epithelial cells that express IL-1β are indicated by the arrowhead. *, P < 0.05 versus allografts from WT recipients; #, P < 0.05 versus allografts from iNOS−/− recipients; †, P < 0.05 versus allografts from eNOS−/− recipients; bar, 5 μm.
Figure 7.
Figure 7.
Serum cytokine levels measured by ELISA 3 wk after transplantation (n = 10 for each group; a–g.) Colocalization of intracellular chemokine expression (MIP-1α, RANTES, and IL-1β) and leukocyte immunophenotype was determined by confocal microscopic examination using immunofluorescent staining technique (h–l). Intracellular chemokines were identified by red emission after the application of an excitation wavelength of 594 nm. CD8+ T cells (h, j, and k) and F4/80+ macrophages (i and l) were labeled with FITC, which was detected as a green emission after the application of an excitation wavelength of 488 nm. Sites of colocalization (yellow) are indicated by arrows and epithelial cells that express IL-1β are indicated by the arrowhead. *, P < 0.05 versus allografts from WT recipients; #, P < 0.05 versus allografts from iNOS−/− recipients; †, P < 0.05 versus allografts from eNOS−/− recipients; bar, 5 μm.

Similar articles

Cited by

References

    1. Berry, G.J., E.M. Brunt, D. Chamberlain, R.H. Hruban, R.K. Sibley, S. Stewart, and H.D. Tazelaar. 1990. A working formulation for the standardization of nomenclature in the diagnosis of heart and lung rejection: lung rejection study group. J. Heart Transplant. 9:593–601. - PubMed
    1. Trulock, E.P. 1997. Lung transplantation. Am. J. Respir. Crit. Care Med. 155:789–818. - PubMed
    1. Hruban, R.H., W.E. Beschorner, W.A. Baumgartner, S.C. Achuff, T.A. Traill, B.R. Marsh, P.K. Gupta, G.M. Hutchins, and B.A. Reitz. 1988. Diagnosis of lung allograft rejection by bronchial intraepithelial Leu-7 positive T lymphocytes. J. Thorac. Cardiovasc. Surg. 96:939–946. - PubMed
    1. Yousem, S.A. 1993. Lymphocytic bronchitis/bronchiolitis in lung allograft recipients. Am. J. Surg. Pathol. 17:491–496. - PubMed
    1. Yousem, S.A., G.J. Berry, P.T. Cagle, D. Chamberlain, A.N. Husain, R.H. Hruban, A. Marchevsky, N.P. Ohori, J. Ritter, S. Stewart, et al. 1996. Revision of the 1990 working formulation for the classification of pulmonary allograft rejection: lung rejection study group. J. Heart Lung Transplant. 15:1–15. - PubMed

Publication types