. 2002 Nov;110(10):1473-82.
doi: 10.1172/JCI15846.

Target organ localization of memory CD4(+) T cells in patients with chronic beryllium disease

Affiliations

Target organ localization of memory CD4(+) T cells in patients with chronic beryllium disease

Andrew P Fontenot et al. J Clin Invest. 2002 Nov.

Abstract

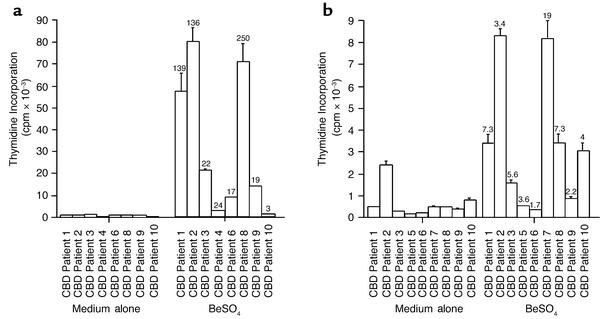
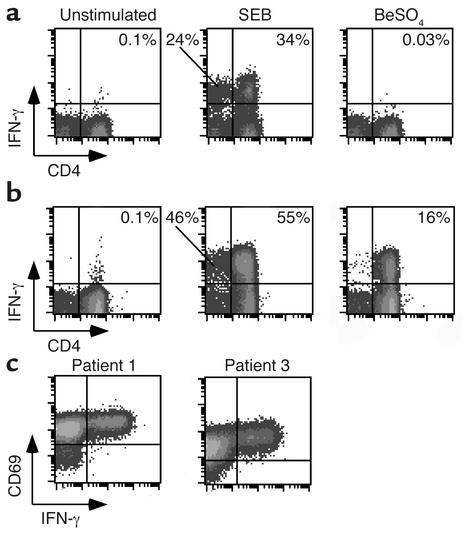
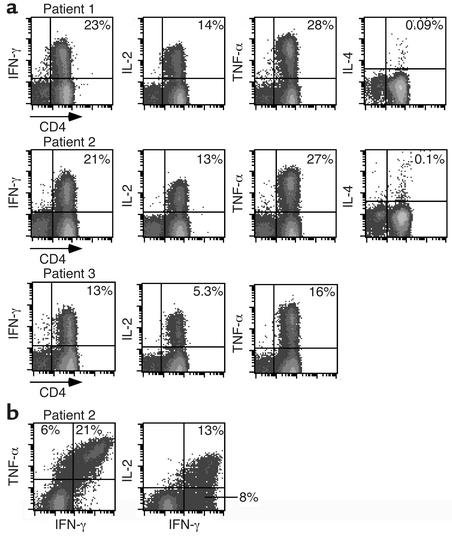
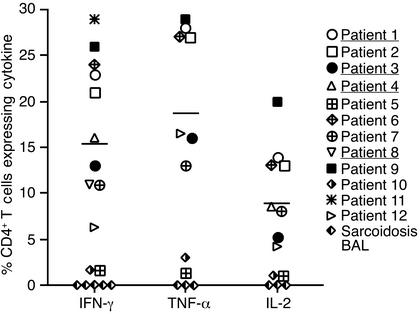
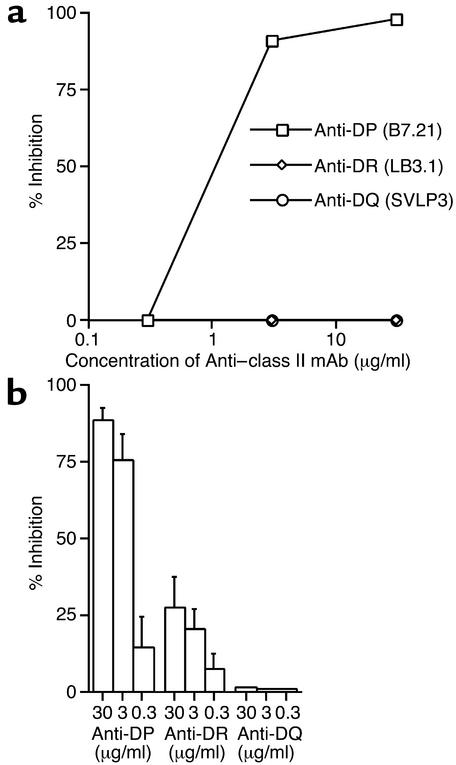
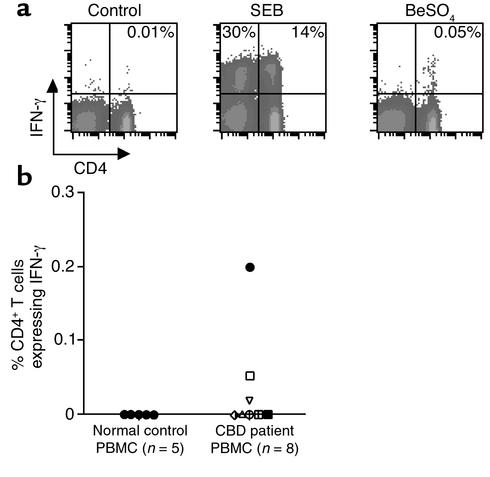
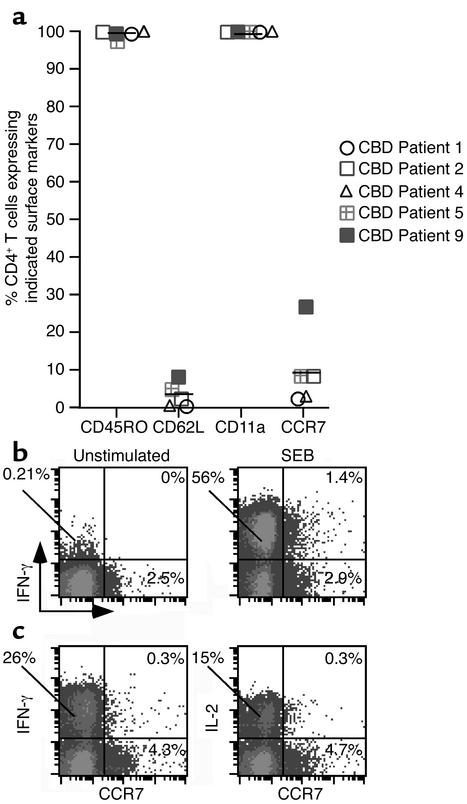
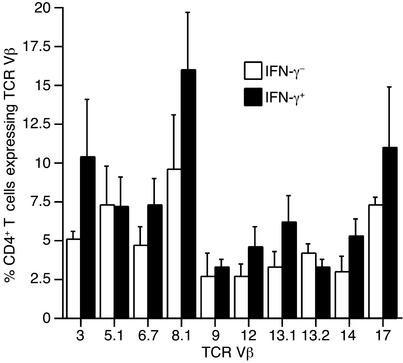
Chronic beryllium disease (CBD) is caused by exposure to beryllium in the workplace, and it remains an important public health concern. Evidence suggests that CD4(+) T cells play a critical role in the development of this disease. Using intracellular cytokine staining, we found that the frequency of beryllium-specific CD4(+) T cells in the lungs (bronchoalveolar lavage) of 12 CBD patients ranged from 1.4% to 29% (mean 17.8%), and these T cells expressed a Th1-type phenotype in response to beryllium sulfate (BeSO(4)). Few, if any, beryllium-specific CD8(+) T cells were identified. In contrast, the frequency of beryllium-responsive CD4(+) T cells in the blood of these subjects ranged from undetectable to 1 in 500. No correlation was observed between the frequency of beryllium-responsive bronchoalveolar lavage (BAL) CD4(+) T cells as detected by intracellular staining and lymphocyte proliferation in culture after BeSO(4) exposure. Staining for surface marker expression showed that nearly all BAL T cells exhibit an effector memory cell phenotype. These results demonstrate a dramatically high frequency and compartmentalization of antigen-specific effector memory CD4(+) cells in the lungs of CBD patients. These studies provide insight into the phenotypic and functional characteristics of antigen-specific T cells invading other inaccessible target organs in human disease.


Figures

Figure 1
Figure 1
Stimulation of BAL cells (a) and PBMCs (b) from the CBD patients. Proliferation of the cells in medium alone and after the addition of 1 × 10⁻⁵ M BeSO4 is shown. Proliferation assays were performed with BAL cells from 8 of the 12 CBD patients and with PBMCs from 9 of the 12 patients. The stimulation index (SI) for each proliferative response is shown over the corresponding bar, and an SI indicative of a positive response is currently defined as ≥ 2.5. The data are expressed as the mean cpm ± SEM.
Figure 2
Figure 2
Intracellular staining for IFN-γ in stimulated BAL T cells. Representative experiments are shown for the flow cytometric analysis of BAL cells from a patient with sarcoidosis (a) or CBD (b) stimulated with either medium alone, SEB, or BeSO4 and subsequently stained for surface CD4 and intracellular IFN-γ expression. The number in the upper right quadrant of each density plot indicates the percentage of CD4+ T cells expressing IFN-γ. (c) Representative flow cytometric staining of BAL cells from two CBD patients shows concordance of expression of the activation marker CD69 with IFN-γ after stimulation with BeSO4.
Figure 3
Figure 3
Intracellular expression of IFN-γ, IL-2, TNF-α, and IL-4 after stimulation of BAL CD4+ T cells with BeSO4. (a) Staining patterns are shown for BAL cells from CBD patients 1, 2, and 3 after short-term culture with BeSO4. The percentage of CD4+ T cells expressing the various Th1 and Th2 cytokines is shown in the upper right quadrant of each density plot. The expression of IL-4 after BeSO4 exposure was not determined for CBD patient 3. (b) Flow cytometric analyses of TNF-α versus IFN-γ and IL-2 versus IFN-γ are shown for CD4+ T cells from CBD patient 2 following exposure to BeSO4. The percentage of CD4+ T cells expressing both cytokines is shown in the upper right quadrant of the density plot.
Figure 4
Figure 4
Percentage of BAL CD4+ T cells that express intracellular IFN-γ, TNF-α, and IL-2 after stimulation with BeSO4. The mean percentage of Th1 cytokines produced by BAL cells from CBD patients is shown as a solid line: mean ± SEM for IFN-γ, 15.3% ± 2.7% (n = 12); TNF-α, 17.9% ± 3.6% (n = 9); and IL-2, 8.8% ± 1.9% (n = 10). Patients being treated with corticosteroids are underlined.
Figure 5
Figure 5
Inhibition of beryllium-induced IFN-γ expression with mAb’s to MHC class II molecules. (a) BAL cells from CBD patient 12 were cultured with BeSO4 and increasing concentrations of mAb’s to HLA-DP, -DR, and -DQ. The data are presented as percent inhibition of IFN-γ expression. (b) Mean (± SEM) percent inhibition of beryllium-induced IFN-γ expression for the five CBD patients studied as shown in a.
Figure 6
Figure 6
Intracellular expression of IFN-γ in peripheral blood CD4+ T cells after stimulation with SEB or BeSO4. (a) A representative experiment is shown for a flow cytometric analysis of PBMCs from CBD patient 2 stimulated with medium alone, SEB, or BeSO4 and stained for surface CD4 and intracellular IFN-γ expression. The number in the upper right quadrant of each density plot represents the percentage of CD4+ T cells expressing IFN-γ. (b) The percentage of peripheral blood CD4+ T cells that express IFN-γ after stimulation with BeSO4 is shown for eight CBD patients and five healthy control subjects. The symbols for each CBD patient correspond to those shown in Figure 4.
Figure 7
Figure 7
Surface markers expressed by BAL CD4+ T cells from CBD patients. (a) The percentage of BAL CD4+ T cells that express CD45RO, CD62L, CD11a, and CCR7 is shown. The symbols for each CBD patient correspond to those shown in Figures 4 and 6, and the solid line represents the mean value for each marker. (b) Intracellular IFN-γ production by BAL CD4+ T cells in relation to expression of CCR7 following stimulation with medium alone or SEB. Data are shown for the percentage of BAL CD4+ T cells that express IFN-γ, CCR7, or both. (c) IFN-γ and IL-2 production by BAL CD4+ T cells in relation to expression of CCR7 following stimulation with BeSO4. Data are shown for the percentage of BAL CD4+ T cells that express IFN-γ, CCR7, or both.
Figure 8
Figure 8
TCR V regions expressed on BAL CD4+ T cells from five CBD patients. Data are expressed as the mean ± SEM percentage of IFN-γ and IFN-γ+ CD4+ T cells that express the indicated TCR Vβ.

References

    1. Newman, L.S., Maier, L.A., and Nemery, B. 1998. Interstitial lung disorders due to beryllium and cobalt. In Interstitial lung disease. M.I. Schwarz and T.E. King, Jr., editors. B.C. Decker Inc. Hamilton, Ontario. 367–392.
    1. Fontenot AP, Newman LS, Kotzin BL. Chronic beryllium disease: T cell recognition of a metal presented by HLA-DP. Clin Immunol. 2001;100:4–14. - PubMed
    1. Kreiss K, Wasserman S, Mroz MM, Newman LS. Beryllium disease screening in the ceramics industry: blood test performance and exposure-disease relations. J Occup Med. 1993;35:267–274. - PubMed
    1. Kreiss K, Mroz MM, Zhen B, Martyny JW, Newman LS. Epidemiology of beryllium sensitization and disease in nuclear workers. Am Rev Respir Dis. 1993;148:985–991. - PubMed
    1. Kreiss K, Mroz MM, Newman LS, Martyny J, Zhen B. Machining risk of beryllium disease and sensitization with median exposures below 2 μg/m3. Am J Ind Med. 1996;30:16–25. - PubMed

Publication types

MeSH terms