. 2002 Dec;76(24):12574-83.
doi: 10.1128/jvi.76.24.12574-12583.2002.

Transcriptional regulation of the K1 gene product of Kaposi's sarcoma-associated herpesvirus

Affiliations

Transcriptional regulation of the K1 gene product of Kaposi's sarcoma-associated herpesvirus

Brian S Bowser et al. J Virol. 2002 Dec.

Abstract

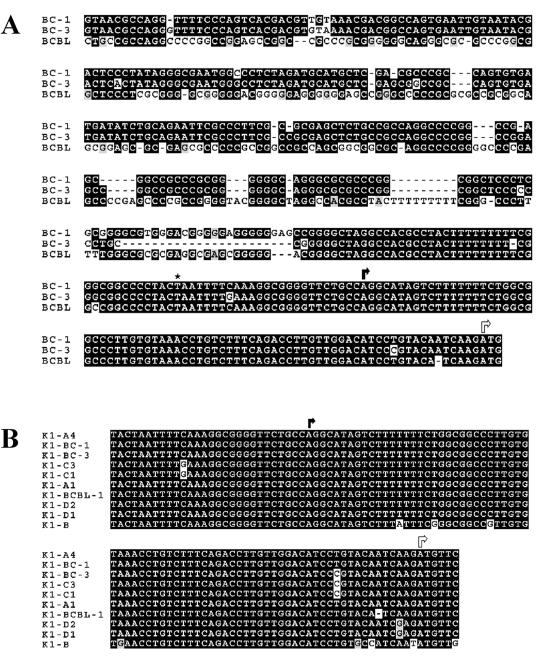
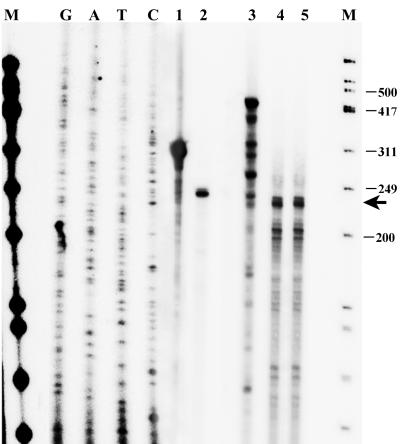
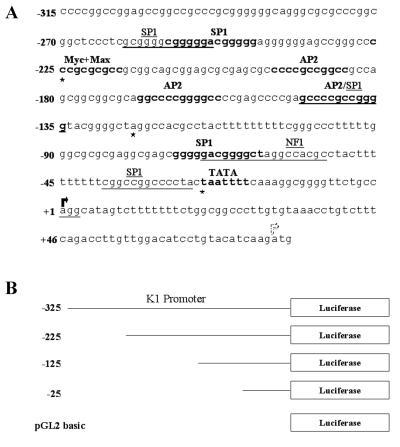
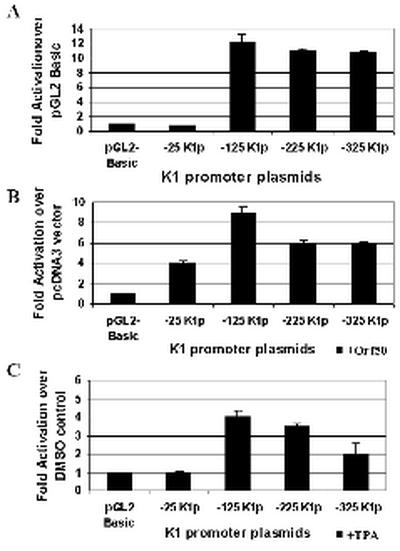
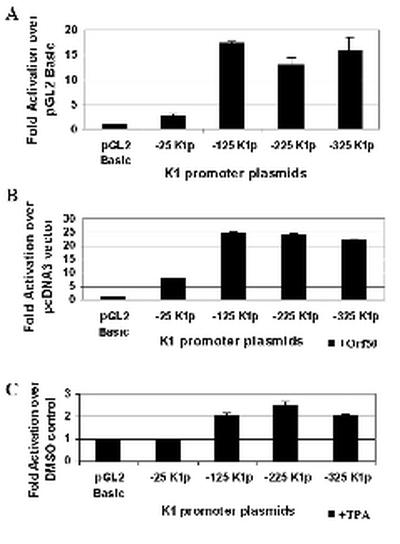
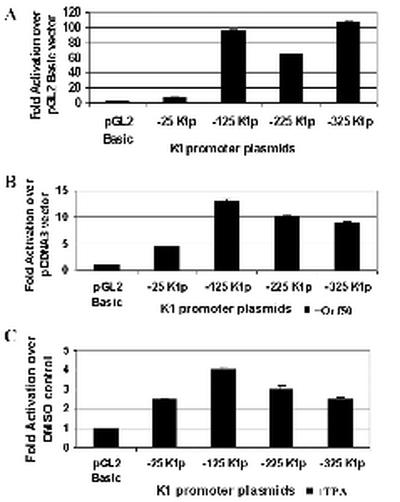
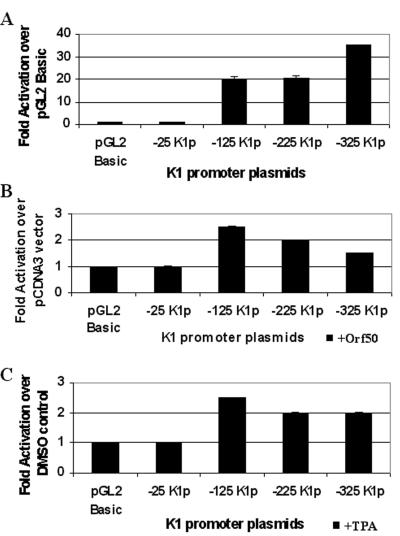
The K1 protein of Kaposi's sarcoma-associated herpesvirus (KSHV) has been shown to be a transforming protein capable of inducing morphological changes and focus formation in rodent fibroblasts. K1 can activate B-cell receptor (BCR) signaling and upregulate activity of the NFAT and NF-kappaB transcription factors. In order to understand the regulation of K1 gene expression, we have analyzed sequences upstream of the K1 gene to identify the K1 promoter element. We have performed 5' rapid amplification of cDNA ends as well as a nuclease protection assay to map the transcriptional start site of the KSHV K1 transcript. The K1 transcriptional start site lies 75 bp upstream of the translation start site. Sequences upstream of the K1 gene were characterized for their ability to activate a luciferase reporter gene in 293 epithelial cells, KSHV-negative B cells (BJAB), KSHV-positive B cells (BCBL-1), and KS tumor-derived endothelial cells (SLK-KS(-)). We found that a 125-bp sequence upstream of the K1 transcript start site was sufficient to fully activate the luciferase reporter gene in all cell types tested. In addition, the viral transcription factor KSHV Orf50/Rta was capable of further activating this promoter element in 293, BJAB, and BCBL-1 cells but not in SLK-KS(-) cells. Promoter constructs containing additional sequences upstream of the 125-bp element did not show further augmentation of transcription in the presence or absence of KSHV Orf50.


Figures

FIG. 1.
FIG. 1.
Characterization of the K1 promoter region in KSHV-positive BCBL-1, BC-1, and BC-3 cells. (A) A Clustal W alignment of sequences upstream of the K1 gene in BCBL-1, BC-1, and BC-3 cells is shown. Identical nucleotides are highlighted in black boxes, and divergent nucleotides are highlighted in gray boxes. Based on data from the 5′-RACE experiments, the transcription start site (black arrow) for K1 was assigned to a position 75 bp upstream of the translation start site (white arrow). The putative TATA box (asterisk) for transcription of K1 is located 25 bp upstream of the transcription start site. (B) GenBank sequences upstream of K1 from all four clades of KSHV isolates were aligned with the BCBL-1, BC-1, and BC-3 sequences by using the Clustal W alignment program. The identical nucleotides are highlighted in black boxes, and divergent nucleotides are highlighted in gray boxes. The transcription start site is depicted with a black arrow, and the translation start site is depicted with a white arrow.
FIG. 2.
FIG. 2.
Analysis of the K1 transcript by RPA. BCBL-1 cells were treated with DMSO or TPA, and RNA was isolated 48 h later. Total RNA from TPA-treated or DMSO-treated cells was hybridized overnight to an antisense radiolabeled, gel-purified K1 riboprobe, and this was followed by an RPA performed with a mixture of RNase A and RNase T1. Lane 3 represents the undigested 429-bp K1 antisense riboprobe used in the RPA. Lanes 4 and 5 represent the 232-bp protected K1 transcript in DMSO- and TPA-treated BCBL-1 cells, respectively. A control β-actin RPA was also performed with an antisense β-actin riboprobe. Lane 1 represents the undigested 334-bp β-actin antisense riboprobe used in the RPA, and lane 2 represents the 250-bp protected β-actin transcript. The products of the RPA were run on an 8% denaturing acrylamide gel in parallel with a radiolabeled φX174/HinFI DNA marker from Promega (lanes M) and a sequencing ladder (lanes G, A, T, and C) to determine the size of the protected fragments in the RPA. The arrow indicates the 232-bp protected fragment representing K1 transcripts in both DMSO-treated and TPA-treated BCBL-1 cells. Numbers at right represent sizes of the marker in base pairs.
FIG. 3.
FIG. 3.
The K1 promoter from the BCBL-1 KSHV genome. (A) Transcription factor binding sites in the K1 promoter from BCBL-1 cells are depicted. The sequence was analyzed with the MatInspector program from Genomatix. (B) Sequences upstream of the K1 start site were cloned upstream of the luciferase reporter gene in the pGL2-Basic plasmid (Promega). These constructs contain 25, 125, 225, and 325 nucleotides upstream of the K1 transcription start site. The pGL2-Basic vector itself contains no promoter of its own. Asterisks represent the 5′ end of the different K1 promoter fragments used. Bold or underlined letters represent transcription factor binding sites, which are often overlapping.
FIG. 4.
FIG. 4.
Analysis of K1 promoter activity in BCBL-1 cells. (A) K1 promoter activity in the context of latent KSHV infection was measured by transfections of the K1 promoter constructs in BCBL-1 B cells. Transfection efficiencies were normalized by using a plasmid expressing β-galactosidase. Cells were left untreated and harvested 48 h posttransfection. Luciferase activity was measured for each construct and normalized to β-galactosidase activity. Activity of each promoter construct is represented as fold activation over the pGL2-Basic vector control. (B) Each of the K1 promoter constructs was cotransfected with a pcDNA3-Orf50 expression plasmid into BCBL-1 cells. Luciferase activities were measured and normalized as described above. Activity of each promoter construct is represented as fold activation over the pcDNA3 vector control. (C) The effects of TPA induction on the K1 promoter were tested by performing the same transfections described for panel A but treating cells with TPA to induce the KSHV lytic cycle or DMSO (negative control). Activity of each promoter construct is represented as fold activation over the DMSO control.
FIG. 5.
FIG. 5.
Analysis of K1 promoter activity in BJAB cells. (A) K1 promoter activity in KSHV-negative B cells was measured by transfections of the four K1 promoter constructs into BJAB B cells. Transfection efficiencies were normalized by using a plasmid expressing β-galactosidase. Cells were left untreated and harvested 48 h posttransfection. Luciferase activity was measured for each construct and normalized to β-galactosidase activity. Activity of each promoter construct is represented as fold activation over the pGL2-Basic vector control. (B) Each of the K1 promoter constructs was cotransfected with a pcDNA3-Orf50 expression plasmid into BJAB cells. Luciferase activities were measured and normalized as described above. Activity of each promoter construct is represented as fold activation over the pcDNA3 vector control. (C) The effects of TPA induction on the K1 promoter were tested by performing the same transfections described for panel A but treating cells with TPA or DMSO (negative control). Activity of each promoter construct is represented as fold activation over the DMSO control.
FIG. 6.
FIG. 6.
Analysis of K1 promoter activity in 293 epithelial cells. (A) K1 promoter activity in 293 epithelial cells was measured by transfections of the K1 promoter constructs into these cells. Transfection efficiencies were normalized by using a plasmid expressing β-galactosidase. Cells were left untreated and harvested 48 h posttransfection. Luciferase activity was measured for each construct and normalized to β-galactosidase activity. Activity of each promoter construct is represented as fold activation over the pGL2-Basic vector control. (B) Each of the K1 promoter constructs was cotransfected with a pcDNA3-Orf50 expression plasmid into 293 cells. Luciferase activities were measured and normalized as described above. Activity of each promoter construct is represented as fold activation over the pcDNA3 vector control. (C) The effects of TPA induction on the K1 promoter were tested by performing the same transfections described for panel A but treating cells with TPA or DMSO (negative control). Activity of each promoter construct is represented as fold activation over the DMSO control.
FIG. 7.
FIG. 7.
K1 promoter activity in SLK-KS endothelial cells. (A) K1 promoter activity in KSHV-negative endothelial cells was measured by transfections of the K1 promoter constructs into SLK-KS cells. Transfection efficiencies were normalized by using a plasmid expressing β-galactosidase. Cells were left untreated and harvested 48 h posttransfection. Luciferase activity was measured for each construct and normalized to β-galactosidase activity. Activity of each promoter construct is represented as fold activation over the pGL2-Basic vector control. (B) Each of the K1 promoter constructs was cotransfected with a pcDNA3-Orf50 expression plasmid into SLK-KS cells. Luciferase activities were measured and normalized as described above. Activity of each promoter construct is represented as fold activation over the pcDNA3 vector control. (C) The effects of TPA induction on the K1 promoter were tested by performing the same transfections described for panel A but treating cells with TPA or DMSO (negative control). Activity of each promoter construct is represented as fold activation over the DMSO control.

References

    1. Albrecht, J. C., J. Nicholas, D. Biller, K. R. Cameron, B. Biesinger, C. Newman, S. Wittmann, M. A. Craxton, H. Coleman, B. Fleckenstein, and R. W. Honess. 1992. Primary structure of the herpesvirus saimiri genome. J. Virol. 66:5047-5058. - PMC - PubMed
    1. Alexander, L., L. Denenkamp, A. Knapp, M. Auerbach, B. Damania, and R. C. Desrosiers. 2000. The primary sequence of rhesus monkey rhadinovirus isolate 26-95: sequence similarities to Kaposi's sarcoma-associated herpesvirus and rhesus monkey rhadinovirus isolate 17577. J. Virol. 74:3388-3398. - PMC - PubMed
    1. Angel, P., M. Imagawa, R. Chiu, B. Stein, R. J. Imbra, H. J. Rahmsdorf, C. Jonat, P. Herrlich, and M. Karin. 1987. Phorbol ester-inducible genes contain a common cis element recognized by a TPA-modulated trans-acting factor. Cell 49:729-739. - PubMed
    1. Antman, K., and Y. Chang. 2000. Kaposi's sarcoma. N. Engl. J. Med. 342:1027-1038. - PubMed
    1. Boshoff, C., T. F. Schulz, M. M. Kennedy, A. K. Graham, C. Fisher, A. Thomas, J. O. McGee, R. A. Weiss, and J. J. O'Leary. 1995. Kaposi's sarcoma-associated herpesvirus infects endothelial and spindle cells. Nat. Med. 1:1274-1278. - PubMed

Publication types

Substances

LinkOut - more resources