. 2002 Dec;76(24):12691-702.
doi: 10.1128/jvi.76.24.12691-12702.2002.

Effects of membrane potential and sphingolipid structures on fusion of Semliki Forest virus

Affiliations

Effects of membrane potential and sphingolipid structures on fusion of Semliki Forest virus

Andrey V Samsonov et al. J Virol. 2002 Dec.

Abstract

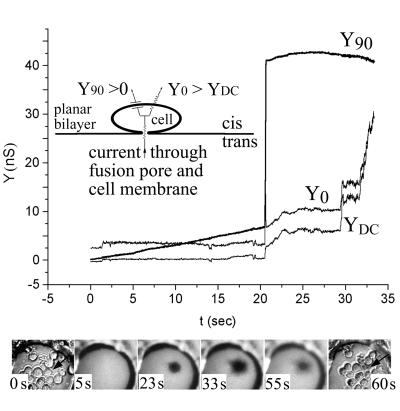
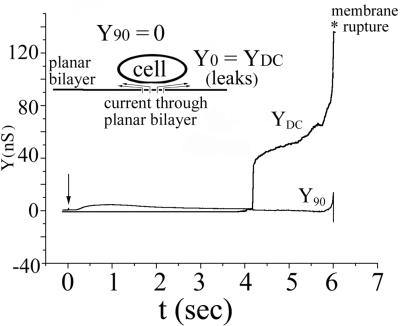
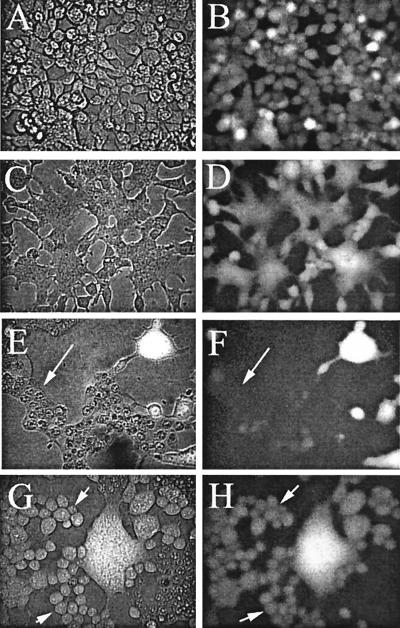
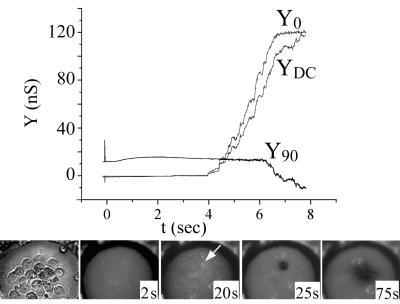
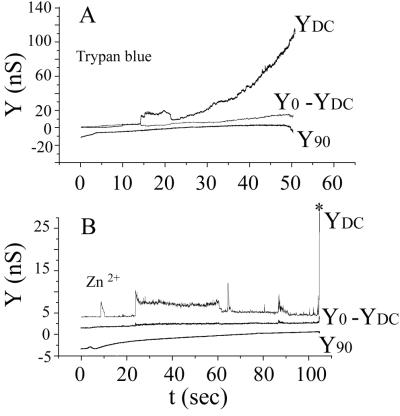
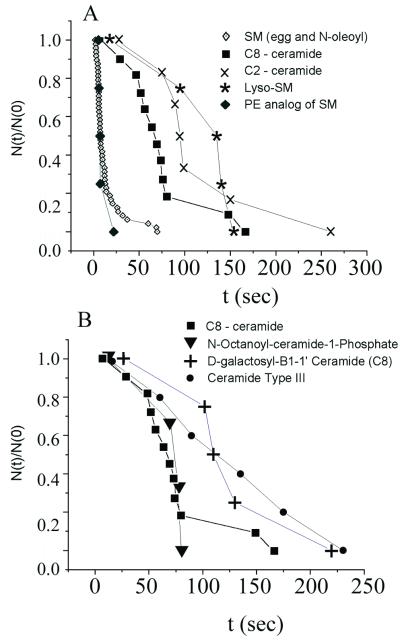
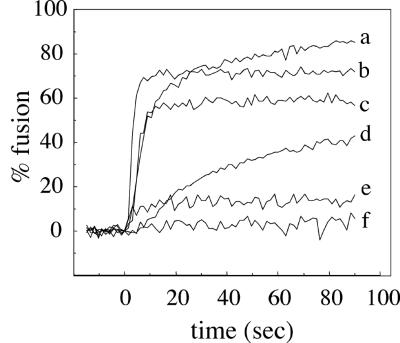
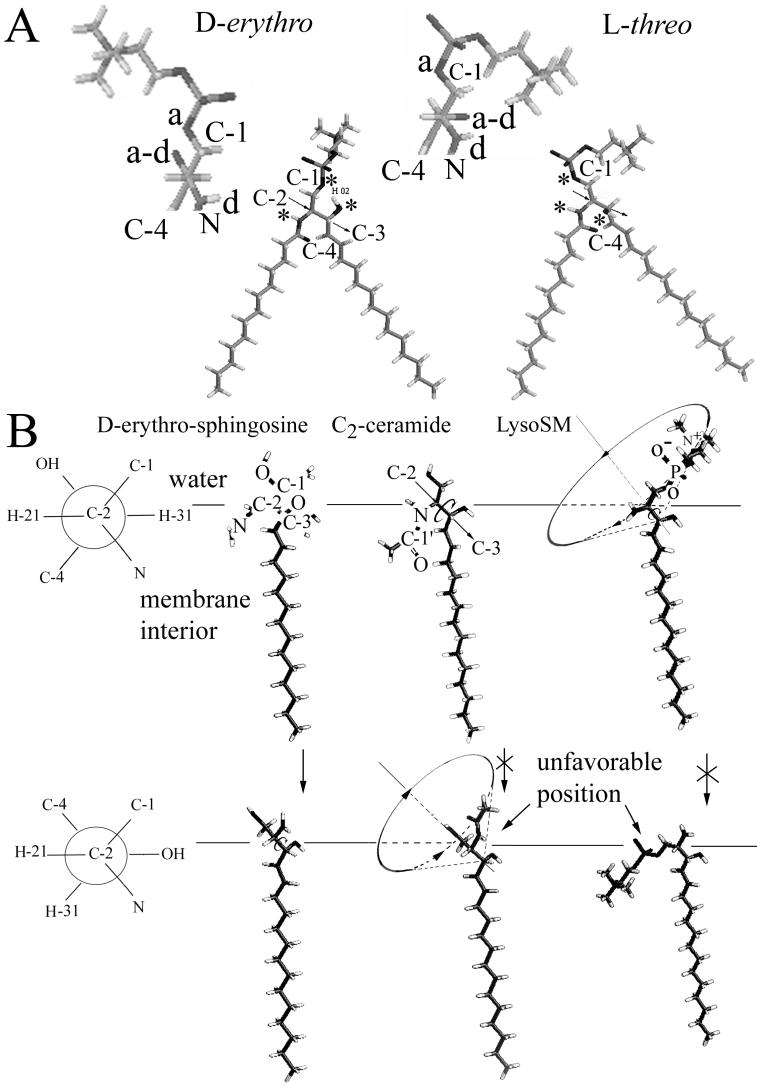
Cells expressing the E1 and E2 envelope proteins of Semliki Forest virus (SFV) were fused to voltage-clamped planar lipid bilayer membranes at low pH. Formation and evolution of fusion pores were electrically monitored by capacitance measurements, and membrane continuity was tracked by video fluorescence microscopy by including rhodamine-phosphatidylethanolamine in the bilayer. Fusion occurred without leakage for a negative potential applied to the trans side of the planar membrane. When a positive potential was applied, leakage was severe, obscuring the observation of any fusion. E1-mediated cell-cell fusion occurred without leakage for negative intracellular potentials but with substantial leakage for zero membrane potential. Thus, negative membrane potentials are generally required for nonleaky fusion. With planar bilayers as the target, the first fusion pore that formed almost always enlarged; pore flickering was a rare event. Similar to other target membranes, fusion required cholesterol and sphingolipids in the planar membrane. Sphingosine did not support fusion, but both ceramide, with even a minimal acyl chain (C(2)-ceramide), and lysosphingomyelin (lyso-SM) promoted fusion with the same kinetics. Thus, unrelated modifications to different parts of sphingosine yielded sphingolipids that supported fusion to the same degree. Fusion studies of pyrene-labeled SFV with cholesterol-containing liposomes showed that C(2)-ceramide supported fusion while lyso-SM did not, apparently due to its positive curvature effects. A model is proposed in which the hydroxyls of C-1 and C-3 as well as N of C-2 of the sphingosine backbone must orient so as to form multiple hydrogen bonds to amino acids of SFV E1 for fusion to proceed.


Figures

FIG. 1.
FIG. 1.
Cell fusion is triggered at low pH under conditions of trans-negative potential. HEK 293T cells expressing E1/E2 were fused to a planar membrane composed of DOPC-DOPE-cholesterol-SM-rho-PE (in moles percent, 41/20/25/5/9) with a −40 mV potential applied to the trans solution. Fusion was triggered by adjusting the pH to 5.6 (t = 0). Electrical traces (top panel): upon fusion, the pore quickly enlarged. This was observed as both a fast, step-like increase in Y90 and a transient increase in Y0 that returned to the sloping baseline. The increase in YDC shows that the membrane became leaky. In this experiment, fusion occurred somewhat more slowly after acidification and leakage was somewhat less severe than was typical. Images (lower panel): the first and last images show the cells in bright-field microscopy, before and after fusion. The four middle panels show fluorescence images at the indicated times. Soon after a pore enlarged as determined electrically, the rho-PE-labeled planar membrane became dark at the site of the fused cell (marked by an arrow in the two bright-field images). This is the pattern of fluorescence expected of full pore enlargement. The cell lost bright-field contrast after fusion.
FIG. 2.
FIG. 2.
Leaks, but not fusion, are triggered at low pH under conditions of trans-positive potentials. All conditions were the same as for Fig. 1 except that a potential of +40 mV was applied to the trans solution. Upon lowering of pH (arrow), YDC increased soon thereafter, indicating leakage. The absence of an increase in Y90 shows that fusion did not occur. The absence of fusion was confirmed by the absence of changes in the fluorescence and bright-field images (not shown). The membrane broke after the leakage became severe. For trans-positive potentials, fusion does not occur prior to severe bilayer leakage.
FIG. 3.
FIG. 3.
Cell-cell fusion occurred without loss of aqueous contents for negative potentials but with loss for zero membrane potentials. Calcein-AM was loaded into transfected cells, and cell-cell fusion was induced as described in Materials and Methods. Panels A, C, E, and G are phase-contrast images, and panels B, D, F, and H are fluorescence images. Images in panels A and B were captured prior to lowering of pH. All other images were taken 30 min after the low-pH treatment. Images in panels C and D show cells bathed by a high-Na+-content medium (i.e., negative potentials). As seen in panel D, calcein was retained by all the fused cells. Images in panels E to H are cells bathed by high-K+-content medium (i.e., zero voltage). Here, calcein leaked from some of the syncytia (marked by arrows in panels E and F) but not from others (bright syncytia in upper right corner of panel F). All unfused cells (some marked by arrows in panels G and H) retained calcein. Thus, only if cells fused at zero potential did they leak calcein.
FIG. 4.
FIG. 4.
E1/E2-expressing cells can hemifuse with planar membranes. All conditions were the same as for Fig. 1 with a potential of −40 mV applied to the trans solution. As shown in the electrical traces, Y90 did not increase after reduction of pH, but both Y0 and YDC did increase. The large increases in Y0 and YDC eventually corrupted the setting of the phase angle, causing the artifactual decrease in Y90 at 6 s. As shown in the lower images, some cells brightened due to the spread of rho-PE, showing that hemifusion occurred (arrow at 20 s). Because Y0 was somewhat greater than YDC, small pores or leaks may have developed in the hemifusion diaphragm. Eventually full fusion could occur, seen here by the darkening of the planar membrane (image at 25 s) at the site of the previously hemifused cell. First image, bright-field microscopy; subsequent images, fluorescence.
FIG. 5.
FIG. 5.
Trypan blue and Zn2+ inhibited fusion but not bilayer conductance increases. All conditions were the same as for Fig. 1 with a potential of −40 mV applied to the trans solution. Trypan blue (250 μM) (A) or 1 mM Zn2+ (B) was added to the cis solution after settling of the cells on the planar membrane and before pH treatment. Fusion did not occur after reduction of pH, as seen by the absence of increases in Y90 and the finding that Y0 = YDC. The conductance of the planar membrane (YDC) increased in a smooth fashion in the presence of trypan blue and in step-like fashion in the presence of Zn2+. The conductance increases were much greater in the presence of trypan blue than in the presence of Zn2+ (note the differences in scales). The membrane ruptured from a small conductance in the presence of Zn2+ (marked by the asterisk in panel B) and in the presence of trypan blue (A), after the membrane became very leaky.
FIG. 6.
FIG. 6.
The dependence of fusion kinetics on sphingolipid structure. Experimental conditions were the same as for Fig. 1 except that SM was replaced with the indicated sphingolipid. Waiting-time distributions were generated (see Materials and Methods). (A) SM and ceramide-PE yielded faster kinetics of fusion than did the ceramides. Lyso-SM supported fusion with kinetics comparable to those of the ceramides. (B) The kinetics of fusion for ceramides or cerobrosides in the planar bilayer membrane were similar. Neither the precise head group of the cerobroside nor the length of the amide-linked acyl chain on the ceramide strongly affected kinetics.
FIG. 7.
FIG. 7.
Fusion of pyrene-labeled SFV with liposomes containing various lipid compositions. Real-time fluorescence recordings of fusion of pyrene-labeled SFV (0.6 μM phospholipid) with the indicated liposomes (200 μM lipid) at 22°C. The liposome compositions were based on DOPC-DOPE-cholesterol (in moles percent, 41/29/22), plus the indicated sphingolipid or ceramide at 8 mol%. The specific sphingolipid component and any added fatty acid are as indicated for each liposome type. Each curve is the average of two independent experiments. Liposomes are sphingolipid deficient with free AA (50 μM) (a) or control, containing SM (b); or contain C2-ceramide (c); contain lyso-SM plus free AA (50 μM) (d); are sphingolipid deficient (e); or contain lyso-SM (f). For samples b, c, e, and f, liposomes and virus were mixed, the samples were preequilibrated for 3 min at 22°C, and the pH was adjusted to 5.5 at time zero. For samples a and d, liposomes plus AA were preequilibrated for 5 min at 22°C. Pyrene-labeled virus was then added at t = −15 s, and the mixture was adjusted to pH 5.5 at time zero.
FIG.8.
FIG.8.
Requirements for C-2-C-3 rotation around their bond. (A) The structure of the two stereoisomers of SM, d-erythro and l-threo, is shown. The positions of hydrogen bond donors and acceptors are indicated by asterisks. The C-2-C-3 axis is indicated by the arrow. The orientation of the hydrogen bond donors and acceptors as well as of the head group of SM viewed along the C-2-C-3 axis is shown in the detached blowup where “a” represents a hydrogen bond acceptor, “d” is a donor, and “a-d” is a hydroxyl that can serve as either an acceptor or donor. Clearly the structures formed by the hydrogen bond donors and acceptors are quite distinct for the two stereoisomers; thus, one (d-erythro) form but not the other can, on first principles, specifically interact with SFV E1. Most significantly, the hydroxyl group on C3 points into the page (i.e., down) for d-erythro but out of the page (i.e., up) l-threo. (B) The Neuman projection (see www.uic.edu/∼kbruzik/text/chaper6.htm for a description of Neuman projections), shown on the left, shows the molecule along the C-2-C-3 axis, with C-2 in front projecting three branches (e.g., to H-21, C-1, and N), and C-3 in the back (beneath C-2 in this view) represented by a circle with its three outgoing bonds (to C-4, OH, and H-31). In the side view of the lipids, the straight arrow (shown for C2-ceramide) represents the C-2-C-3 axis and the counterclockwise arrow indicates rotation around the C-2-C-3 bond. As illustrated in the top row, the hydrogens of C-2 (H-21) and C-3 (H-31) can assume an antiperiplanar configuration for sphingosine, C2-ceramide, and lyso-SM. But as illustrated in the bottom row, these hydrogens can exist in a synclinal orientation only for sphingosine. The acyl chain of a ceramide would have to enter the aqueous phase and the polar head group of lyso-SM would have to partition into the hydrocarbon portion of the membrane for the synclinal orientation to occur.

Similar articles

Cited by

References

    1. Akeson, M., J. Scharff, C. M. Sharp, and D. M. Neville, Jr. 1992. Evidence that plasma membrane electrical potential is required for vesicular stomatitis virus infection of MDCK cells: a study using fluorescence measurements through polycarbonate supports. J. Membr. Biol. 125:81-91. - PubMed
    1. Bron, R., J. M. Wahlberg, H. Garoff, and J. Wilschut. 1993. Membrane fusion of Semliki Forest virus in a model system: correlation between fusion kinetics and structural changes in the envelope glycoprotein. EMBO J. 12:693-701. - PMC - PubMed
    1. Bruzik, K. S. 1988. Conformation of the polar head group of sphingomyelin and its analogues. Biochim. Biophys. Acta 939:315-326. - PubMed
    1. Chatterjee, P. K., M. Vashishtha, and M. Kielian. 2000. Biochemical consequences of a mutation that controls the cholesterol dependence of Semliki Forest virus fusion. J. Virol. 74:1623-1631. - PMC - PubMed
    1. Chen, Z., and R. P. Rand. 1997. The influence of cholesterol on phospholipid membrane curvature and bending elasticity. Biophys. J. 73:267-276. - PMC - PubMed

Publication types

MeSH terms

LinkOut - more resources