Comparative Study
. 2002 Nov 26;99(24):15468-73.
doi: 10.1073/pnas.202614899. Epub 2002 Nov 15.

Identification of endoglin as a functional marker that defines long-term repopulating hematopoietic stem cells

Affiliations
Comparative Study

Identification of endoglin as a functional marker that defines long-term repopulating hematopoietic stem cells

Chang-Zheng Chen et al. Proc Natl Acad Sci U S A. .

Abstract

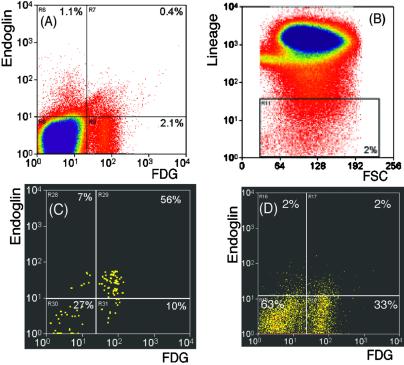
We describe a strategy to obtain highly enriched long-term repopulating (LTR) hematopoietic stem cells (HSCs) from bone marrow side-population (SP) cells by using a transgenic reporter gene driven by a stem cell enhancer. To analyze the gene-expression profile of the rare HSC population, we developed an amplification protocol termed "constant-ratio PCR," in which sample and control cDNAs are amplified in the same PCR. This protocol allowed us to identify genes differentially expressed in the enriched LTR-HSC population by oligonucleotide microarray analysis using as little as 1 ng of total RNA. Endoglin, an ancillary transforming growth factor beta receptor, was differentially expressed by the enriched HSCs. Importantly, endoglin-positive cells, which account for 20% of total SP cells, contain all the LTR-HSC activity within bone marrow SP. Our results demonstrate that endoglin, which plays important roles in angiogenesis and hematopoiesis, is a functional marker that defines LTR HSCs. Our overall strategy may be applicable for the identification of markers for other tissue-specific stem cells.


Figures

Fig 1.
Fig 1.
Use of the SCLβgeo-3′En transgene as a functional genetic marker to enrich HSCs from mouse bone marrow. (A and B) 5-Bromo-4-chloro-3-indolyl β-d-galactoside whole-mount staining of embryonic day 12.5 mice. Compared with the wild-type embryo (A), an embryo carrying the 6E5-βgeo-3′En transgene (SCLβgeo) shows predominant expression of lacZ in the fetal liver (B). Approximately 1–2% of mouse bone marrow cells are positive for the SCLβgeo transgene (C). (DF) Expression of the SCLβgeo transgene in mouse bone marrow analyzed by staining with Hoechst 33342 and the β-galactosidase substrate FDG. SP cells account for ≈0.06% of bone marrow cells (D). Among SCLβgeo transgene-positive cells (FDG-positive gated), ≈1.5% are SP cells (E). (F) SCLβgeo and lineage-expression profile of the bone marrow SP cells (SP cells gated); among all the gated SP cells, ≈30% are positive for the SCLβgeo transgene and approximately half of these are lineage-negative or -low.
Fig 2.
Fig 2.
Schematic diagram of CR-PCR and its application in gene-expression profiling using oligonucleotide microarrays. The key feature of this protocol is that sample and control cDNAs are amplified in the same PCR such that the ratio of individual genes between the sample and control RNAs will not be skewed during amplification. The poly(T) primers consist of oligo(dT), unique sequences (T-1, dark blue; T-2, dark orange), and universal forward sequences (black). These primers are designed to label an individual RNA sample with a specific sequence tag (T1 or T2) in the RT step. A universal primer (SMART oligo, dark green with GGG at the 3′ end) was added to the end of the newly synthesized cDNA by a template-switching mechanism (33). Thus the cDNA products contain common 5′ and 3′ flanking sequences (universal forward, black/gray; universal reverse, dark green/light green) that allow PCR amplification. Equal amounts of RT products from each sample were mixed and amplified with the universal forward and reverse PCR primers. Amplified samples were split into two (or more) equal fractions. A specific T7 promoter containing either the T1 or T2 sequence tag (T7-1 or T7-2) matched to the corresponding poly(T) primer [poly(T-1) or poly(T-2)] was used to selectively add a T7 promoter to the corresponding fraction of cDNAs in the mixture by linear extension reaction using DNA polymerase. cRNA samples were generated by in vitro transcription and subjected to oligonucleotide microarray analysis. Differentially expressed genes were identified based on the fluorescent intensity ratio of individual genes. Throughout, complementary sequences are shown as a lighter color of the matching strand (e.g., light blue versus dark blue).
Fig 3.
Fig 3.
FACS analysis shows that endoglin is differentially expressed on the enriched HSC SCLβgeopos SP Linneg/low population. Bone marrow cells from SCLβgeo transgenic mice were stained with antiendoglin antibody, Hoechst 33342, and lineage markers. (A) Endoglin and SCLβgeo expression in total bone marrow cells. (B) Gate for Linneg/low cells. FSC, forward scatter. (C) Endoglin and SCLβgeo expression profile of gated Linneg/low SP cells. (D) Endoglin and SCLβgeo expression profile of gated Linneg/low non-SP cells.
Fig 4.
Fig 4.
Endopos cells are enriched for LTR-HSC activity in bone marrow SP cells. (A and B) Correlation of endoglin and SCLβgeo expression in bone marrow SP cells. (A) Lineage and SCLβgeo (FDG) profile of bone marrow SP cells. (B) Lineage and endoglin profile of bone marrow SP cells. In both A and B Endopos SP cells are depicted as yellow dots and Endoneg SP cells are red dots. Arbitrary gates were set for lineage-marker expression: neg, low, and high. The blue quadrant in B was the sorting gate used to divide bone marrow SP cells into four cell populations: Endopos Linneg, Endopos Linlow, Endoneg Linneg, and Endoneg Linlow/hi cells. (C) Competitive repopulation analysis of Endopos SP cells (solid orange line and error bar) and Endoneg SP cells (dotted green line and error bar). Shown here is the donor contribution (% Ly5.1) by Endopos SP cells and Endoneg SP cells at 4, 16, and 26 weeks posttransplantation. One hundred Endopos SP or 375 Endoneg SP cells were injected into each recipient. (D) Competitive repopulation analysis of Endopos SP Linneg (orange bar) and Endopos SP Linlow (green bar) cells. Shown here is the CRU per 105 donor cells in the Endopos SP Linneg (orange bar) and Endopos SP Linlow (green bar) groups at 4, 14, and 28 weeks posttransplantation. Forty-two Endopos SP Linneg and 139 Endopos SP Linlow cells were injected into each recipient.

References

    1. Abramson S., Miller, R. G. & Phillips, R. A. (1977) J. Exp. Med. 145 1567-1579. - PMC - PubMed
    1. Till J. E. & McCulloch, E. A. (1961) Radiat. Res. 14 213-222. - PubMed
    1. Jordan C. T. & Lemischka, I. R. (1990) Genes Dev. 4 220-232. - PubMed
    1. Osawa M., Hanada, K., Hamada, H. & Nakauchi, H. (1996) Science 273 242-245. - PubMed
    1. Zhong R. K., Astle, C. M. & Harrison, D. E. (1996) J. Immunol. 157 138-145. - PubMed

Publication types

MeSH terms