Comparative Study
. 2002 Nov 26;99(24):15584-9.
doi: 10.1073/pnas.242608099. Epub 2002 Nov 18.

A comparison of the molecular clock of hepatitis C virus in the United States and Japan predicts that hepatocellular carcinoma incidence in the United States will increase over the next two decades

Affiliations
Comparative Study

A comparison of the molecular clock of hepatitis C virus in the United States and Japan predicts that hepatocellular carcinoma incidence in the United States will increase over the next two decades

Yasuhito Tanaka et al. Proc Natl Acad Sci U S A. .

Abstract

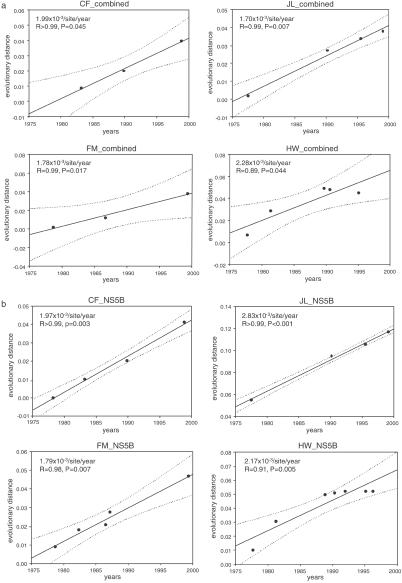
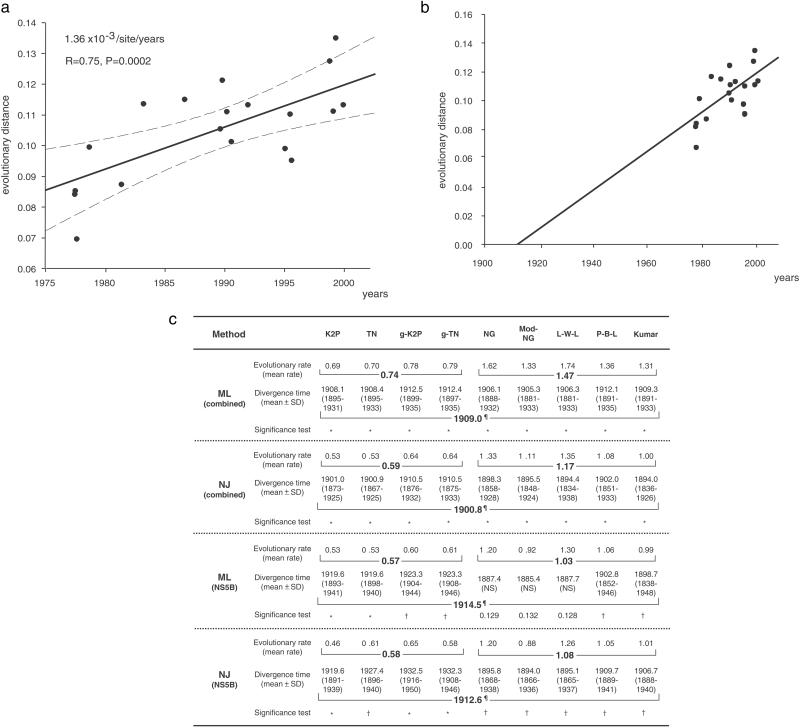
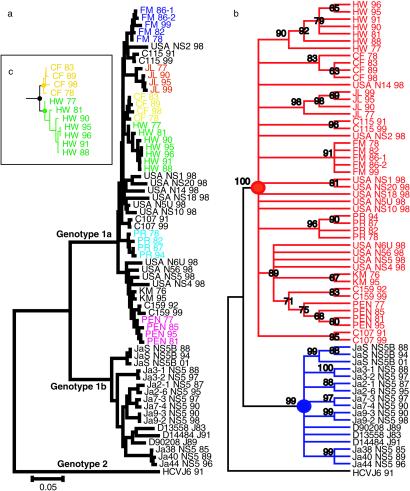
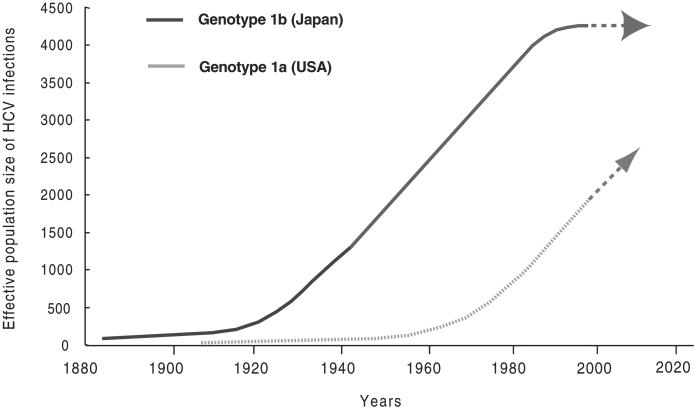
The prevalence of hepatitis C virus (HCV)-related hepatocellular carcinoma (HCC) is considerably lower in the U.S. than in Japan. To elucidate this difference, we determined the time origin of the HCV epidemic in each country by using molecularly clocked long-term serial samples obtained from HCV carriers of genotypes 1a and 1b. The molecular clock estimated that HCV genotype 1 first appeared in Japan in around 1882, whereas emergence in the U.S. was delayed until around 1910. In addition, by statistical analysis using coalescent theory, the major spread time for HCV infection in Japan occurred in the 1930s, whereas widespread dissemination of HCV in the U.S. occurred in the 1960s. These estimates of viral spread time are consistent with epidemiologic observations and predict that the burden of HCC in the U.S. will increase in the next two to three decades, possibly to equal that currently experienced in Japan.


Figures

Fig. 1.
Fig. 1.
The molecular clock within each individual obtained from National Institutes of Health prospective studies. (a) The regression analyses within combined regions were based on the evolutionary distances using Pamilo-Bianchi-Li model (P-B-L; P < 0.05). Note that each molecular clock within each single host was different [(1.70–2.28) × 10−3 nucleotide substitutions per site per year]. (b) Based on a phylogenetic tree within the NS5B region constructed by the NJ method, the figures for the four patients in A became statistically more significant with the inclusion of more data points (P < 0.01).
Fig. 2.
Fig. 2.
Estimating the most recent common ancestor of genotype 1a in the U.S. based on data collected over the last three decades. (a) A regression analysis within combined regions was performed to estimate a mean molecular clock. The mean evolutionary rates (solid regression line) of the P-B-L model indicated 1.36 × 10⁻³ per site per year (P = 0.0002). The 95% confidence intervals of the regression line are indicated by broken lines. (b) The divergence time of the most recent common ancestor of U.S. genotype 1a was estimated to have occurred around 1910, which is supported by most evolutionary models (c). (c) By using the mean molecular clock derived from regression analyses of serially determined phylogenetic trees, the divergence time of the most recent common ancestor of genotype 1a in the U.S. was estimated. Models for evolutionary analyses are explained in Methods. Phylogenetic trees were analyzed by the maximum likelihood and the NJ methods. To estimate the divergence time (mean ± SD), 500 bootstrap replicates were generated by random-with-replacement resampling of the data points to determine the molecular origin of ancestral sequences. Mean and SD of the divergence times also were determined. Standard significance testing was conducted. *, P < 0.01; †, P < 0.05; ¶, mean of 95% significance divergence time (year); NS, not significant. Evolutionary rate = number of nucleotide substitutions × 10−3 per site per year.
Fig. 3.
Fig. 3.
A phylogenetic tree within NS5B region constructed by NJ method. (a) HCV genotype 2a (HCV J6 strain: ) was used as an outgroup. Each subject with serial strains in the National Institutes of Health study that had a significantly independent cluster is indicated by color. (b) By using an outgroup (HCV J6), U.S. genotype 1a strains (red) and Japanese genotype 1b strains (blue) were shown to diverge from each ancestral point (solid circle). The numbers indicate bootstrap reliability (1,000×). Most individual clusters were reliable at >80%. (c) The timing of an individual's HCV infection was estimated as the interval between an individual's most recent ancestral point and the divergence point of each individual's cluster. For example, a solid yellow circle was the most recent ancestral point of patient “CF.” A solid green circle was the most recent ancestral point of patient “HW.” A solid black circle was the divergence point of both “CF” cluster and “HW” cluster. In this phylogenetic tree, HW's HCV infection timing was thought to be the period between the divergence time of the solid green circle and the divergence time of the solid black circle.
Fig. 4.
Fig. 4.
The effective population size of HCV in the U.S. relative to the population size in Japan over the past century. The growth (spread time) of the U.S. HCV genotype 1a population was estimated to have occurred around 1960, at least 30 years later than the spread time of genotype 1b population in Japan. The HCV genotype 1b population in Japan has already reached an equilibrium prevalence while U.S. genotype 1a is still growing exponentially. Future prediction is indicated by arrows.

References

    1. Alter M. J. (1995) Semin. Liver Dis. 15 5-14. - PubMed
    1. Mansell C. J. & Locarnini, S. A. (1995) Semin. Liver Dis. 15 15-32. - PubMed
    1. Nishioka K., Watanabe, J., Furuta, S., Tanaka, E., Iino, S., Suzuki, H., Tsuji, T., Yano, M., Kuo, G., Choo, Q. L., et al. (1991) Cancer 67 429-433. - PubMed
    1. Shiratori Y., Shiina, S., Imamura, M., Kato, N., Kanai, F., Okudaira, T., Teratani, T., Tohgo, G., Toda, N., Ohashi, M., et al. (1995) Hepatology 22 1027-1033. - PubMed
    1. Kiyosawa K., Sodeyama, T., Tanaka, E., Gibo, Y., Yoshizawa, K., Nakano, Y., Furuta, S., Akahane, Y., Nishioka, K., Purcell, R. H., et al. (1990) Hepatology 12 671-675. - PubMed

Publication types

MeSH terms

LinkOut - more resources