

Connexin36 is essential for transmission of rod-mediated visual signals in the mammalian retina
- PMID: 12441058
- PMCID: PMC2834592
- DOI: 10.1016/s0896-6273(02)01046-2
Connexin36 is essential for transmission of rod-mediated visual signals in the mammalian retina
Abstract
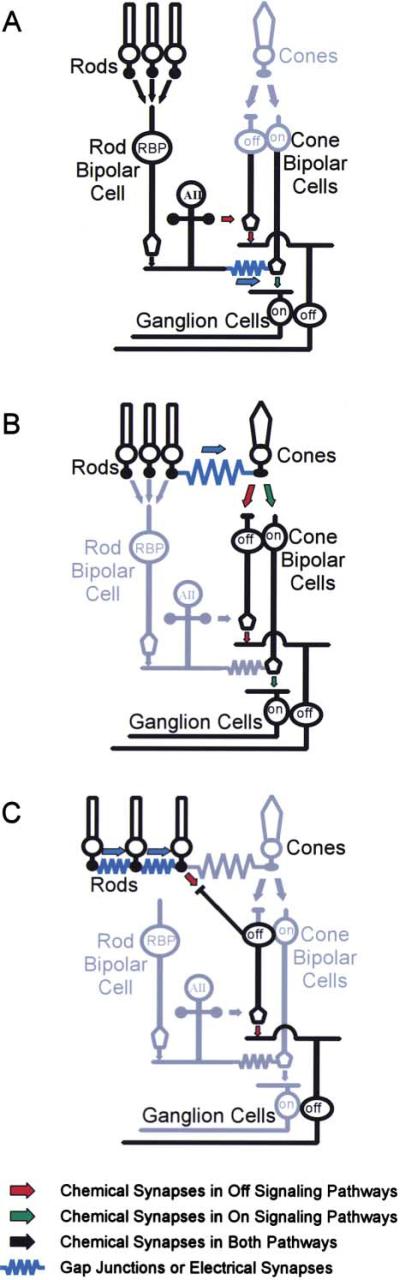
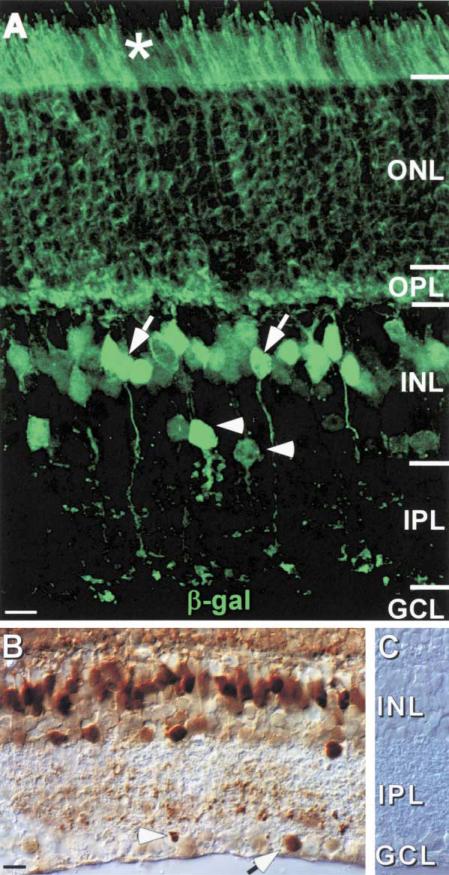
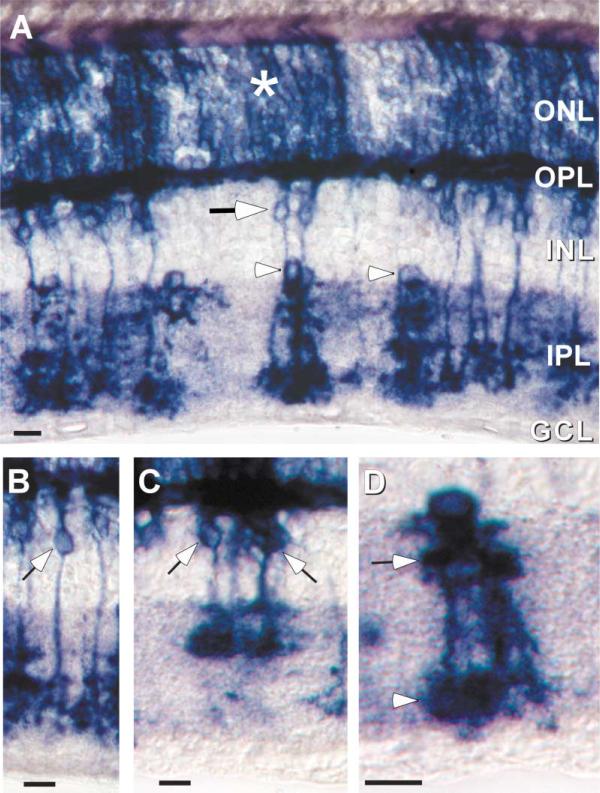
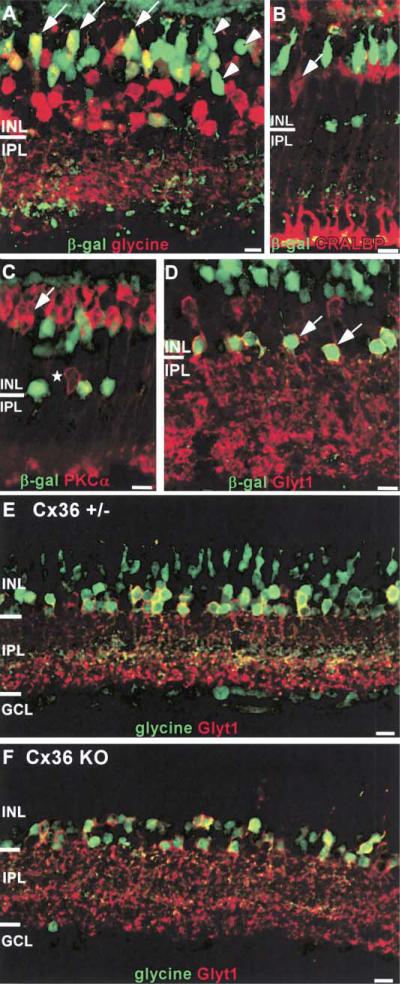
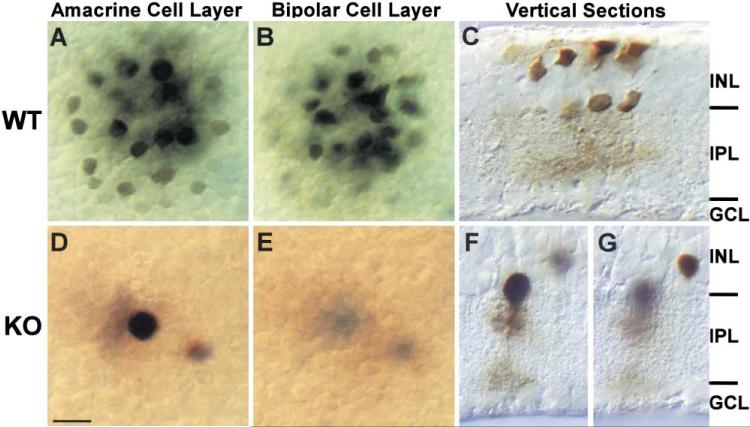
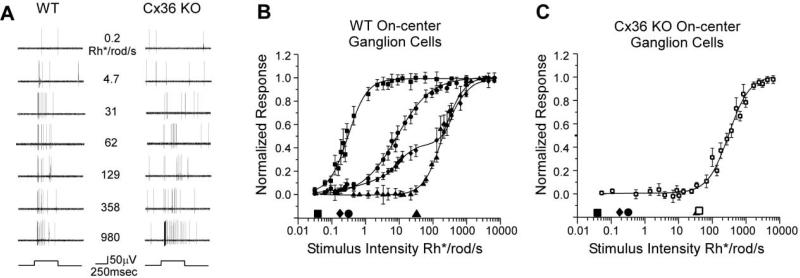
To examine the functions of electrical synapses in the transmission of signals from rod photoreceptors to ganglion cells, we generated connexin36 knockout mice. Reporter expression indicated that connexin36 was present in multiple retinal neurons including rod photoreceptors, cone bipolar cells, and AII amacrine cells. Disruption of electrical synapses between adjacent AIIs and between AIIs and ON cone bipolars was demonstrated by intracellular injection of Neurobiotin. In addition, extracellular recording in the knockout revealed the complete elimination of rod-mediated, on-center responses at the ganglion cell level. These data represent direct proof that electrical synapses are critical for the propagation of rod signals across the mammalian retina, and they demonstrate the existence of multiple rod pathways, each of which is dependent on electrical synapses.
Figures
Comment in
-
Connexin36 forms synapses essential for night vision.Neuron. 2002 Nov 14;36(4):551-3. doi: 10.1016/s0896-6273(02)01062-0. Neuron. 2002. PMID: 12441044 Review.
Similar articles
-
Intrinsic properties and functional circuitry of the AII amacrine cell.Vis Neurosci. 2012 Jan;29(1):51-60. doi: 10.1017/S0952523811000368. Vis Neurosci. 2012. PMID: 22310372 Free PMC article. Review.
-
Differential output of the high-sensitivity rod photoreceptor: AII amacrine pathway.J Comp Neurol. 2008 Apr 10;507(5):1653-62. doi: 10.1002/cne.21617. J Comp Neurol. 2008. PMID: 18241050 Free PMC article.
-
Expression of neuronal connexin36 in AII amacrine cells of the mammalian retina.J Neurosci. 2001 Jan 1;21(1):230-9. doi: 10.1523/JNEUROSCI.21-01-00230.2001. J Neurosci. 2001. PMID: 11150340 Free PMC article.
-
Mouse ganglion-cell photoreceptors are driven by the most sensitive rod pathway and by both types of cones.PLoS One. 2013 Jun 7;8(6):e66480. doi: 10.1371/journal.pone.0066480. Print 2013. PLoS One. 2013. PMID: 23762490 Free PMC article.
-
Multiple neuronal connexins in the mammalian retina.Cell Commun Adhes. 2003 Jul-Dec;10(4-6):425-30. doi: 10.1080/cac.10.4-6.425.430. Cell Commun Adhes. 2003. PMID: 14681052 Review.
Cited by
-
Retinal bipolar cells borrow excitability from electrically coupled inhibitory interneurons to amplify excitatory synaptic transmission.bioRxiv [Preprint]. 2024 Jul 5:2024.07.03.601922. doi: 10.1101/2024.07.03.601922. bioRxiv. 2024. PMID: 39005421 Free PMC article. Preprint.
-
Dopaminergic Retinal Cell Loss and Visual Dysfunction in Parkinson Disease.Ann Neurol. 2020 Nov;88(5):893-906. doi: 10.1002/ana.25897. Epub 2020 Sep 19. Ann Neurol. 2020. PMID: 32881029 Free PMC article.
-
Intrinsic properties and functional circuitry of the AII amacrine cell.Vis Neurosci. 2012 Jan;29(1):51-60. doi: 10.1017/S0952523811000368. Vis Neurosci. 2012. PMID: 22310372 Free PMC article. Review.
-
Connexin30.2: In Vitro Interaction with Connexin36 in HeLa Cells and Expression in AII Amacrine Cells and Intrinsically Photosensitive Ganglion Cells in the Mouse Retina.Front Mol Neurosci. 2016 May 27;9:36. doi: 10.3389/fnmol.2016.00036. eCollection 2016. Front Mol Neurosci. 2016. PMID: 27303262 Free PMC article.
-
Pikachurin Protein Required for Increase of Cone Electroretinogram B-Wave during Light Adaptation.PLoS One. 2015 Jun 19;10(6):e0128921. doi: 10.1371/journal.pone.0128921. eCollection 2015. PLoS One. 2015. PMID: 26091521 Free PMC article.
References
-
- Aguilar M, Stiles WS. Saturation of the rod mechanism of the retina at high levels of stimulation. Opt. Acta (Lond.) 1954;1:59–65.
-
- Balkema GW, Jr., Pinto LH. Electrophysiology of retinal ganglion cells in the mouse: a study of a normally pigmented mouse and a congenic hypopigmentation mutant, pearl. J. Neurophysiol. 1982;48:968–980. - PubMed
-
- Barlow HB, Levick WR, Yoon M. Responses to single quanta of light in retinal ganglion cells of the cat. Vision Res. Suppl. 1971;3:87–101. - PubMed
-
- Bloomfield SA, Dacheux RF. Rod vision: pathways and processing in the mammalian retina. Prog. Retin. Eye Res. 2001;20:351–384. - PubMed
Publication types
MeSH terms
Substances
Grants and funding
LinkOut - more resources
Full Text Sources
Other Literature Sources
Molecular Biology Databases
Miscellaneous
