. 2002 Dec;11(12):2774-91.
doi: 10.1110/ps.0214502.

Transmembrane helix predictions revisited

Affiliations

Transmembrane helix predictions revisited

Chien Peter Chen et al. Protein Sci. 2002 Dec.

Abstract

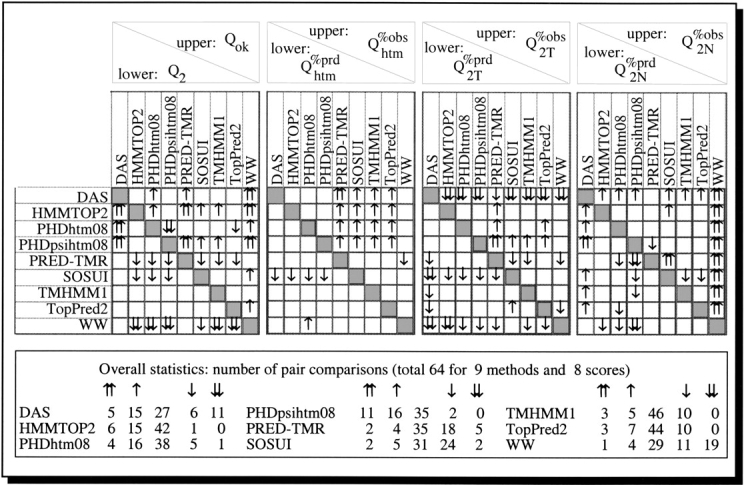
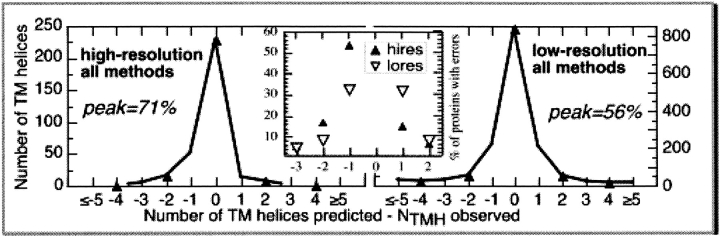
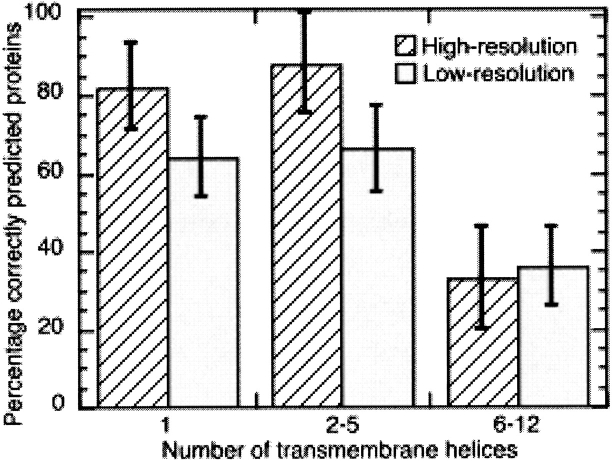
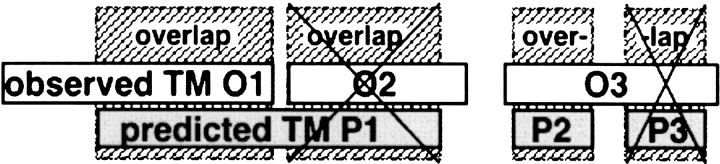
Methods that predict membrane helices have become increasingly useful in the context of analyzing entire proteomes, as well as in everyday sequence analysis. Here, we analyzed 27 advanced and simple methods in detail. To resolve contradictions in previous works and to reevaluate transmembrane helix prediction algorithms, we introduced an analysis that distinguished between performance on redundancy-reduced high- and low-resolution data sets, established thresholds for significant differences in performance, and implemented both per-segment and per-residue analysis of membrane helix predictions. Although some of the advanced methods performed better than others, we showed in a thorough bootstrapping experiment based on various measures of accuracy that no method performed consistently best. In contrast, most simple hydrophobicity scale-based methods were significantly less accurate than any advanced method as they overpredicted membrane helices and confused membrane helices with hydrophobic regions outside of membranes. In contrast, the advanced methods usually distinguished correctly between membrane-helical and other proteins. Nonetheless, few methods reliably distinguished between signal peptides and membrane helices. We could not verify a significant difference in performance between eukaryotic and prokaryotic proteins. Surprisingly, we found that proteins with more than five helices were predicted at a significantly lower accuracy than proteins with five or fewer. The important implication is that structurally unsolved multispanning membrane proteins, which are often important drug targets, will remain problematic for transmembrane helix prediction algorithms. Overall, by establishing a standardized methodology for transmembrane helix prediction evaluation, we have resolved differences among previous works and presented novel trends that may impact the analysis of entire proteomes.


Figures

Fig. 1.
Fig. 1.
Pairwise comparison of methods. For all high-resolution results compiled in Table 2, we show the pairwise comparison for eight different scores and nine methods. Differences by more than one (two) standard error(s) are marked by one (two) arrow(s). Empty boxes indicate that the difference between the respective scores of the two methods is not significant. For example, DAS is two standard errors better than WW in terms of the number of correctly predicted proteins (Qok), whereas HMMTOP2 is two standard errors better than DAS in terms of the overall per-residue accuracy (Q2). The lower table summarizes the respective counts of pair-comparisons for which a particular method is better or worse than the others. TopPred2 and TMHMM1 appear to be the most neutral method (44 and 46 times indistinguishable), whereas DAS seems the most unique method in that it is often better than the others and equally often worse. Note: only DAS, PHDhtm08, PHDpsihtm07, and TopPred2 did not use most of the proteins tested to optimize prediction accuracy; thus, the results for all the other methods are likely to be overestimates.
Fig. 2.
Fig. 2.
Over- and underprediction of membrane helices. All methods (top panel): For all methods and all proteins in the high- and low-resolution sets, the difference between the number of membrane helices predicted and observed is shown. Although the two distributions appear rather similar, the higher symmetry in the low-resolution graph hid that the percentages with no difference were quite different: 71% for the high-resolution data and 56% for the low-resolution data. The inset (center) underlined the observation that the majority of errors were due to under- or overpredicting one helix.
Fig. 3.
Fig. 3.
Proteins with many helices predicted less accurately. We binned the results for all advanced methods according to the number of observed membrane helices such that the three classes contained similar numbers of proteins (X-axis). Accuracy (Y-axis) is measured in terms of the percentage of proteins for which all helices are correctly predicted (Qok). Both, for the high- and the low-resolution data, proteins with more than five membrane helices were predicted at significantly lower levels of accuracy.
Fig. 4.
Fig. 4.
Correctly predicted segments. In this example, there are three observed and three predicted helices. Observed helix O1 is correctly predicted by P1 as they overlap. However, observed helix O2 is not correctly predicted because P1 already overlaps with O1. Hence, P1 cannot be used as a correct prediction for O2. Similarly, P2 is counted as correct only with respect to O3, whereas P3 is not since O3 was already predicted by P2.
Fig. 5.
Fig. 5.
Procedure for estimating error using a bootstrap experiment. Given a data set with N items, one first defines K, which is the number of items one will select from the original data set, and M, which is the number of times one will choose a sample of size K. For instance, if the data set is of size 36, then one defines K < 36. Once K and M are defined, one selects a sample of size K and calculates the average value for the appropriate metric. Repeating this process M times will yield M average values. One can then compile the averaged value and standard deviation for these M average values.

Similar articles

Cited by

References

    1. Altschul, S.F. and Gish, W. 1996. Local alignment statistics. Meth. Enzymol. 266 460–480. - PubMed
    1. Altschul, S., Madden, T., Shaffer, A., Zhang, J., Zhang, Z., Miller, W., and Lipman, D. 1997. Gapped BLAST and PSI-BLAST: A new generation of protein database search programs. Nucleic Acids Res. 25 3389–3402. - PMC - PubMed
    1. Amstutz, P., Forrer, P., Zahnd, C., and Pluckthun, A. 2001. In vitro display technologies: Novel developments and applications. Curr. Opin. Biotechnol. 12 400–405. - PubMed
    1. Bairoch, A. and Apweiler, R. 2000. The SWISS-PROT protein sequence database and its supplement TrEMBL in 2000. Nucleic Acids Res. 28 45–48. - PMC - PubMed
    1. Bauer, M.F., Hofmann, S., Neupert, W., and Brunner, M. 2000. Protein translocation into mitochondria: The role of TIM complexes. TICB 10 25–31. - PubMed

Publication types

Substances