. 2002 Nov 26;99(24):15669-74.
doi: 10.1073/pnas.202608199. Epub 2002 Nov 19.

Genomic analysis of the host response to hepatitis C virus infection

Affiliations

Genomic analysis of the host response to hepatitis C virus infection

Andrew I Su et al. Proc Natl Acad Sci U S A. .

Abstract

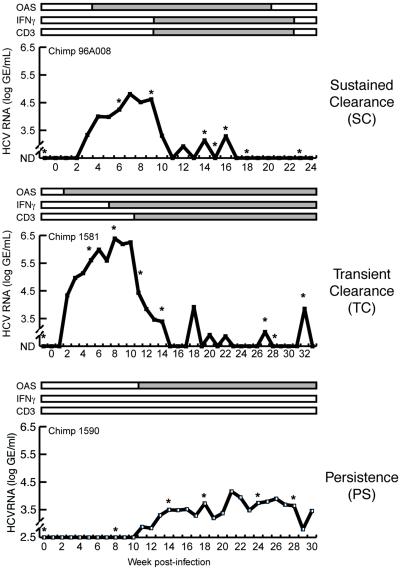
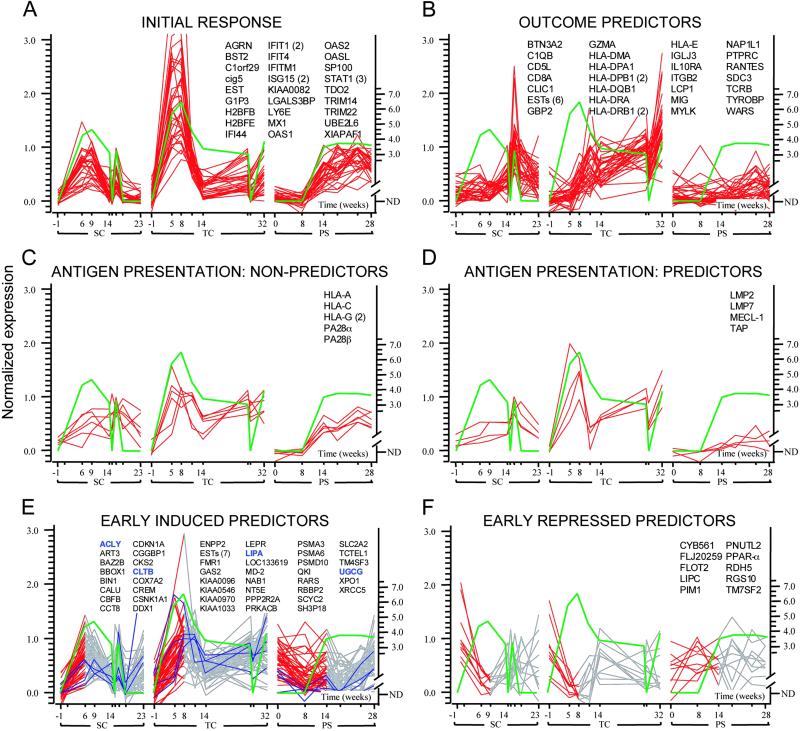
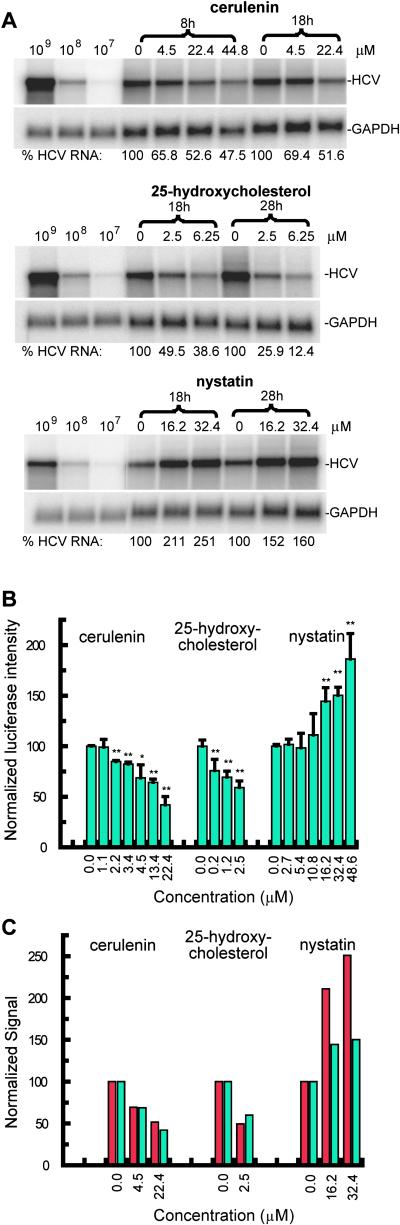
We have examined the progression of hepatitis C virus (HCV) infections by gene expression analysis of liver biopsies in acutely infected chimpanzees that developed persistent infection, transient viral clearance, or sustained clearance. Both common responses and outcome-specific changes in expression were observed. All chimpanzees showed gene expression patterns consistent with an IFN-alpha response that correlated with the magnitude and duration of infection. Transient and sustained viral clearance were uniquely associated with induction of IFN-gamma-induced genes and other genes involved in antigen processing and presentation and the adaptive immune response. During the early stages of infection, host genes involved in lipid metabolism were also differentially regulated. We also show that drugs that affect these biosynthetic pathways can regulate HCV replication in HCV replicon systems. Our results reveal genome-wide transcriptional changes that reflect the establishment, spread, and control of infection, and they reveal potentially unique antiviral programs associated with clearance of HCV infection.


Figures

Fig 1.
Fig 1.
The time course of infection for the three chimpanzees is shown. The x axis indicates the week postinfection at which a liver biopsy was taken. The y axis shows log HCV genome equivalents per milliliter of serum (GE/ml). Values below the limit of detection are shown as not detected (ND). Levels of oligoadenylate synthase, IFN-γ, and CD3 mRNA were also determined by RNase protection assays (8), and their presence in the liver is shown by the gray bars. In this study, gene expression profiling was performed on the biopsy samples at time points indicated by asterisks.
Fig 2.
Fig 2.
Genes coordinately regulated during HCV infections in SC, TC, and PS. Green lines represent log (HCV RNA) patterns with values below the threshold for detection represented by zero. Data traces are shown for different clusters of genes: (A) genes correlating with HCV RNA in all chimpanzees; (B) genes that are negatively correlated with HCV RNA levels during clearance episodes and correlated with IFN-γ levels and T cell influx to the liver (Fig. 1); (C) MHC class I and proteasome nonpredictor genes; (D) antigen presentation-related genes that show outcome-specific expression; (E) early predictors correlated with increasing HCV RNA levels with representative hepatocellular early predictor genes associated with lipid metabolism highlighted in blue; and (F) early predictors negatively correlated with increasing HCV RNA levels. For the early predictor genes in E and F, the portion of the gene expression pattern depicted in red is the region that positively or negatively correlates with the initial rise of HCV RNA. If multiple probes interrogate the same gene, the probe count appears in parentheses. For optimal visualization, gene expression levels were normalized to the 10th and 90th percentiles for each gene. Values on the x axis represent days after inoculation with HCV. The primary data for all clusters can be found in Table 1, which is published as supporting information on the PNAS web site.
Fig 3.
Fig 3.
Effects of drugs that affect cholesterol/lipid metabolism on HCV replicons. (A) Regulation of plus strand HCV replicon RNA levels after treatment of an Huh-7 cell line stably transfected with RNA derived from the pHCVrep1bBB7 (S1179I) plasmid. (B) Results of luciferase assays 18 h after treatment of transiently transfected Huh-7 cell with in vitro transcribed RNA from a modified version of the pFK-I389/Neo/NS3–5B/NK5.1 plasmid with cerulenin, 25-hydroxycholesterol, or nystatin at the indicated concentrations. Measurements were done in triplicate and error bars are shown with asterisks indicating statisitical significance (*, P < 0.05; **, P < 0.01). (C) Direct comparison of the effects of drugs on the different replicons. The data for the HCV subgenomic replicon S1179I are in red and those for the replicon based on pFK-I389/Neo/NS3–5B/NK5.1 are in blue.

Similar articles

Cited by

References

    1. Hagedorn C. H. & Rice, C. M., (1999) Current Topics in Microbiology and Immunology (Springer, Berlin).
    1. Bartenschlager R. & Lohmann, V. (2001) Antiviral Res. 52 1-17. - PubMed
    1. Blight K. J., Kolykhalov, A. A. & Rice, C. M. (2000) Science 290 1972-1974. - PubMed
    1. Bigger C. B., Brasky, K. M. & Lanford, R. E. (2001) J. Virol. 75 7059-7066. - PMC - PubMed
    1. Honda M., Kaneko, S., Kawai, H., Shirota, Y. & Kobayashi, K. (2001) Gastroenterology 120 955-966. - PubMed

Publication types

MeSH terms