. 2002 Dec 10;99(25):16047-51.
doi: 10.1073/pnas.212637899. Epub 2002 Nov 20.

Slaving: solvent fluctuations dominate protein dynamics and functions

Affiliations

Slaving: solvent fluctuations dominate protein dynamics and functions

P W Fenimore et al. Proc Natl Acad Sci U S A. .

Abstract

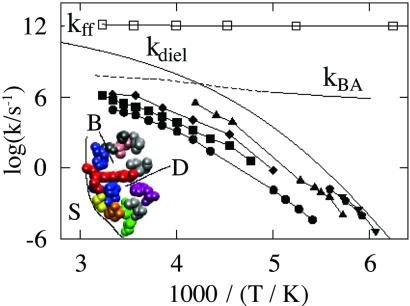
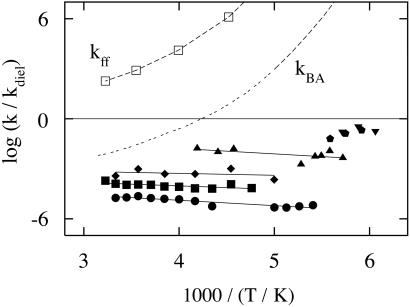
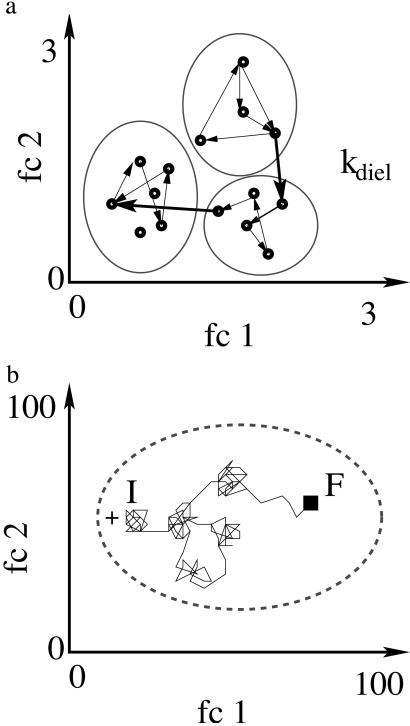
Protein motions are essential for function. Comparing protein processes with the dielectric fluctuations of the surrounding solvent shows that they fall into two classes: nonslaved and slaved. Nonslaved processes are independent of the solvent motions; their rates are determined by the protein conformation and vibrational dynamics. Slaved processes are tightly coupled to the solvent; their rates have approximately the same temperature dependence as the rate of the solvent fluctuations, but they are smaller. Because the temperature dependence is determined by the activation enthalpy, we propose that the solvent is responsible for the activation enthalpy, whereas the protein and the hydration shell control the activation entropy through the energy landscape. Bond formation is the prototype of nonslaved processes; opening and closing of channels are quintessential slaved motions. The prevalence of slaved motions highlights the importance of the environment in cells and membranes for the function of proteins.


Figures

Fig. 1.
Fig. 1.
The temperature dependence of selected rate coefficients in Mb. The rate coefficient for the dielectric fluctuations in the solvent (glycerol/water, 3:1 vol/vol) is denoted by kdiel (2, 7). (Inset) A cross section through part of Mb. In state A, not labeled, the CO ligand binds at the iron in the center of the heme group, shown in red. B indicates the site occupied by CO after dissociation from Fe, and D indicates the CO position in the Xe-1 cavity. The protein rate coefficients refer to binding of CO at the heme iron (kBA) (3), exit into the solvent S (kDS, ▪) (3, 7), equilibrium fluctuations after hole burning (kfluct, ⧫) (18), and fluctuations among the taxonomic substates A0, A1, and A3 (k01, •; k13, ▴) (15, 16). Some of the A-state relaxation data are from ref. . The rate coefficients for the shift of the center frequency and the width (pentagon, ▾) of the CO stretch band after a pressure change are denoted by krelax (14, 15). The dephasing rate of the CO stretching mode of Mb-CO is denoted by kff (17).
Fig. 2.
Fig. 2.
Temperature dependence of the ratio (k/kdiel), where k stands for the rate coefficients of the processes shown in Fig. 1. The symbols are as in Fig. 1.
Fig. 3.
Fig. 3.
2D cross sections through the energy landscape of Mb. The functional coordinates fc1 and fc2 describe the transitions between selected substates (31). (a) Cross section of a small part of the energy landscape. Three statistical substates are shown as shallow craters. The small circles inside the craters are local conformational minima. At temperatures well below 170 K, only transitions among the local conformational minima are observable. Above 170 K, jumps among statistical substates, induced by fluctuations in the solvent and shown as heavy arrows, become observable. (b) At 300 K, each protein performs a random walk in the conformation (energy) landscape. A walk that terminates at the black square opens a channel. A walk starting from an “excited” state describes a relaxation. The actual random walk is far more complex than shown here, because it occurs in a few thousand dimensions rather than the two shown here. The scales in a and b are very different. In a only a very small region in the conformational space is shown; b represents the entire space of a particular taxonomic substate.

References

    1. Feynman R. P., (1963) Six Easy Pieces (Addison–Wesley, Reading, MA), pp. 59.
    1. Huck J. R., Noyel, G. A. & Jorat, L. J. (1988) IEEE Trans. Electr. Insul. 23, 627-638.
    1. Austin R. H., Beeson, K. W., Eisenstein, L., Frauenfelder, H. & Gunsalus, I. C. (1975) Biochemistry 14, 5355-5373. - PubMed
    1. Beece D., Eisenstein, D. L., Frauenfelder, H., Good, D., Marden, M. C., Reinisch, L., Reynolds, A. H., Sorensen, L. B. & Yue, K. T. (1980) Biochemistry 19, 5147-5157. - PubMed
    1. Ansari A., Berendzen, J., Braunstein, D., Cowen, B. R., Frauenfelder, H., Hong, M. K., Iben, I. E. T., Johnson, J. B., Ormos, P., Sauke, T. B. & Scholl, R. (1987) Biophys. Chem. 26, 337-355. - PubMed

Publication types