. 2002 Dec;3(12):1188-94.
doi: 10.1093/embo-reports/kvf244. Epub 2002 Nov 21.

Dynamic behavior of transcription factors on a natural promoter in living cells

Affiliations

Dynamic behavior of transcription factors on a natural promoter in living cells

Matthias Becker et al. EMBO Rep. 2002 Dec.

Abstract

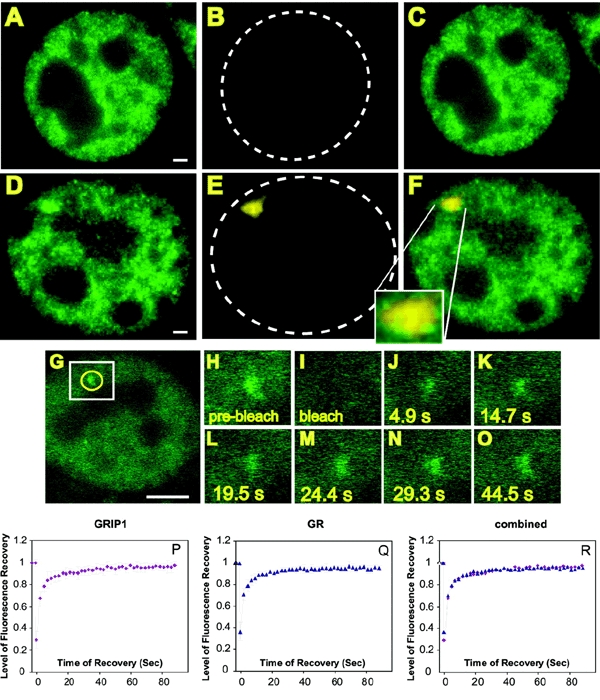
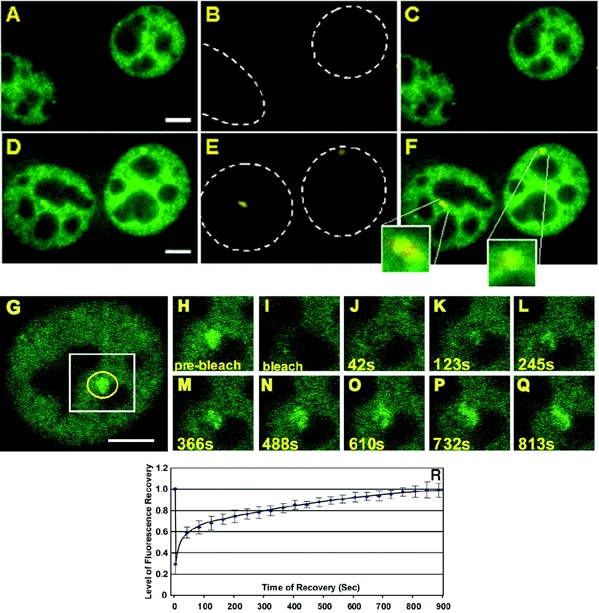
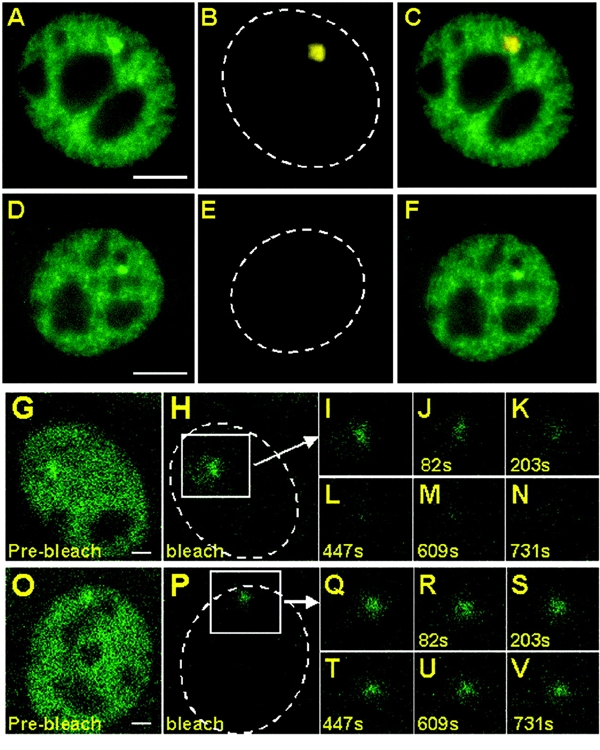
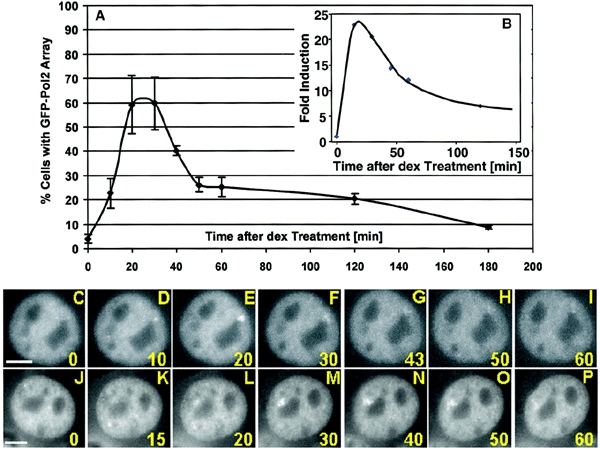
Through the use of photobleaching techniques, we examined the dynamic interaction of three members of the transcription apparatus with a target promoter in living cells. The glucocorticoid receptor (GR) interacting protein 1 (GRIP-1) exhibits a half maximal time for fluorescent recovery (tau(R)) of 5 s, reflecting the same rapid exchange as observed for GR. In contrast, the large subunit (RPB1) of RNA polymerase II (pol II) required 13 min for complete fluorescence recovery, consistent with its function as a processive enzyme. We also observe a complex induction profile for the kinetics of GR-stimulated transcription. Our results indicate that GR and GRIP-1 as components of the activating complex are in a dynamic equilibrium with the promoter, and must return to the template many times during the course of transcriptional activation.


Figures

Figure 1
Figure 1
GFP–GRIP-1 colocalizes with nascent MMTV transcripts detected by RNA FISH and undergoes the same rapid exchange with the LTR as the GR in the continuous presence of ligand. (AF) GFP–GRIP-1 Cells were subjected to RNA FISH analysis. Carrier [ethanol; (A–C)] or dex [100 nM; (D–F)] was added for 1 h prior to fixation. Cells were fixed and processed for RNA FISH. GFP fluorescence alone is shown in (A) and (D). The RNA FISH staining (Cy5 dye) is shown in (B) and (E), the hatched lines outline the nuclei. (C and F) Overlays of (A) and (B) and (D) and (E), respectively, the segment magnification in (F) shows the colocalization of GFP–GRIP-1 and the RNA FISH signal on the array. Scale bars: 1 μm. (GR) FRAP analysis of GFP–GRIP-1 at the MMTV array. GFP–GRIP-1 images show single z-sections. Dex was added at 100 nM for 1 h, cells were imaged before and during fluorescence recovery (H) pre-bleach image. The first post bleach image (I) was collected ∼0.1 s after the bleach followed by images collected at 4.9 s intervals. he 4.9 s (J), 14.7 s (K), 19.5 s (L) 24.4 s (M), 29.3 s (N) and 44.5 s (O) images are shown. (H–O) Represent segment magnifications and correspond to the white box in (G). The yellow circle in (G) marks the position and size of the bleach spot. In this experiment the recovery of fluorescence at the array was completed by 29.3 s and did not change after prolonged time of observation. Note that due to bleaching during imaging the same level of fluorescence as seen in the pre-bleach image is not reached after complete recovery. Scale bar: 5 μm. (P–R) Recovery curves from GFP–GRIP-1 (P), and GFP–GR expressing 3617 cells (Q), treated with dex (100 nM) for 15–90 min. To reach higher resolution of the fluorescence recovery process, the cells were imaged with an interval of 2.3 s. The graphs represent averages of nine separate FRAP data sets. The two proteins show almost identical dynamic properties at the array as shown in the overlay in (R).
Figure 2
Figure 2
GFP–Pol II co-localizes with nascent MMTV transcripts detected by RNA FISH and undergoes very slow exchange with the LTR in the continuous presence of ligand. (AF) Carrier [ethanol; (A–C)] or dex [100nM; (D–F)] was added for 1 h prior to fixation. Cells were fixed and processed for RNA FISH. GFP fluorescence alone is shown in (A) and (D). The RNA FISH staining (Cy5 dye) is shown in (B) and (E). The hatched lines outline the nucleus. (C and F) Overlays of (A) and (B) and (D) and (E), respectively. The segment magnifications in (F) show the co-localization of GFP–Pol II and the RNA FISH signal at the array. Scale bars: 5 μm. (GR) FRAP analysis of GFP–Pol II expressing cells. Images show single z-sections. Dex was added at 100 nM for 15 min, cells were imaged before and during fluorescence recovery (G) pre-bleach image. The first post bleach image (H) was collected ∼0.1 s after the bleach followed by images collected at 40 s intervals. The 42 s (J), 123 s (K), 245 s (L) 366 s (M), 488 s (N) 610 s (O) 732 s (P) and 813 s (Q) images are shown. (H–Q) are segment magnifications and correspond to the white box in (G). The yellow circle in (G) marks the position and size of the bleach spot. In this experiment the recovery of fluorescence at the array was completed by 732 s. Note, that due to bleaching during imaging the same level of fluorescence as seen in the pre-bleach image is not reached after complete recovery. (R) Recovery curve from GFP–Pol II cells, treated with dex (100 nM) for 15–25 min. The graph represents the average of nine FRAP experiments. Scale bar: 5 μm.
Figure 3
Figure 3
Inhibition of MMTV transcription by actinomycin D leads to the immobilization of GFP–Pol II on the array. Dex (100nM) alone (AC) or dex (100 nM) and AMD (2.5 μg/ml) (DF) was added for 20 min. Cells were fixed and processed for RNA FISH. GFP fluorescence alone is shown in (A) and (D). The RNA FISH staining (Cy5 dye) is shown in (B) and (E). The hatched lines outline the nucleus. (C) Composite image of (A) and (B) and (F) composite image of (D) and (E). Scale bars: 5 μm. (G–V) iFRAP analysis of cells treated with dex (100 nM) (GN) or dex (100 nM) and AMD (OV). (G) and (O) pre-bleach images. The first post bleach images (H) and (P) were collected ∼0.3 s after the bleach followed by images collected at 40 s intervals. (I–N) and (Q–V) are segment magnifications and correspond to the white boxes in (H) and (P), respectively. The hatched lines outline the nucleus. Scale bars: 2 μm.
Figure 4
Figure 4
GFP–Pol II shows an early peak in array staining after dex treatment with heterogeneity between individual cells. (A) Appearance of GFP–Pol II stained arrays in a cell population after dex treatment. The graph shows the percentage of cells with a GFP–Pol II illuminated array over a time course of 180 min. For each time point the presence or absence of a GFP–Pol II stained array was determined in 120–180 cells. The graph represents the results of three individual experiments. (B) Nuclear run-on assays were done on nuclei isolated from 3134 cells treated for 0, 15, 30, 45, 60 and 120 min with 100 nM dex. Levels of MMTV transcription are expressed as fold induction with basal transcription (0 min) set to a value of 1. (CP) Time-lapse study of individual cells after hormone treatment. Scale bars: 5 μm.

Similar articles

Cited by

References

    1. Archer T.K., Lee H.-L., Cordingley M.G., Mymryk J.S., Fragoso G., Berard D.S. and Hager G.L. (1994) Differential steroid hormone induction of transcription from the mouse mammary tumor virus promoter. Mol. Endocrinol., 8, 568–576. - PubMed
    1. Baumann C.T., Ma H., Wolford R.G., Reyes J.C., Maruvada P., Lim C.S., Yen P.M., Stallcup M.R. and Hager G.L. (2001) The glucocorticoid receptor interacting protein 1 (GRIP-1) localizes in discrete nuclear foci that associate with ND10 nuclear bodies and are enriched in components of the 26S proteasome. Mol. Endocrinol., 15, 485–500. - PubMed
    1. Becker P.B., Gloss B., Schmid W., Strahle U. and Schutz G. (1986) In vivo protein–DNA interactions in a glucocorticoid response element require the presence of the hormone. Nature, 324, 686–688. - PubMed
    1. Chodosh L.A., Fire A., Samuels M. and Sharp P.A. (1989) 5,6-dichloro-1-β-D-ribofuranosylbenzimidazole inhibits transcription elongation by RNA polymerase II in vitro. J. Biol. Chem., 264, 2250–2257. - PubMed
    1. Fragoso G., Pennie W.D., John S. and Hager G.L. (1998) The position and length of the steroid-dependent hypersensitive region in the mouse mammary tumor virus long terminal repeat are is invariant despite multiple nucleosome B frames. Mol. Cell. Biol., 18, 3633–3644. - PMC - PubMed

Publication types

MeSH terms