. 2002 Dec;22(24):8415-25.
doi: 10.1128/MCB.22.24.8415-8425.2002.

A sequence element downstream of the yeast HTB1 gene contributes to mRNA 3' processing and cell cycle regulation

Affiliations

A sequence element downstream of the yeast HTB1 gene contributes to mRNA 3' processing and cell cycle regulation

Susan G Campbell et al. Mol Cell Biol. 2002 Dec.

Erratum in

  • Mol Cell Biol. 2008 Mar;28(5):1873

Abstract

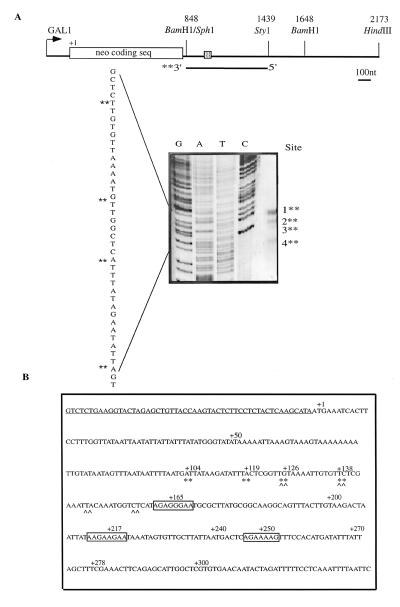
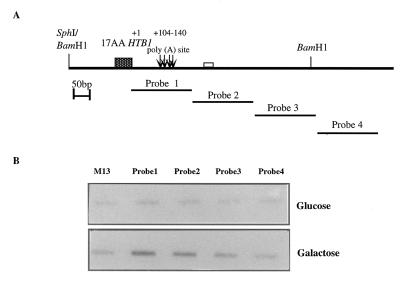
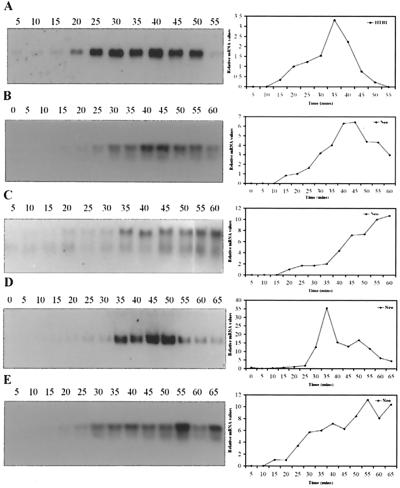
Histone mRNAs accumulate in the S phase and are rapidly degraded as cells progress into the G(2) phase of the cell cycle. In Saccharomyces cerevisiae, fusion of the 3' untranslated region and downstream sequences of the yeast histone gene HTB1 to a neomycin phosphotransferase open reading frame is sufficient to confer cell cycle regulation on the resulting chimera gene (neo-HTB1). We have identified a sequence element, designated the distal downstream element (DDE), that influences both the 3'-end cleavage site selection and the cell cycle regulation of the neo-HTB1 mRNA. Mutations in the DDE, which is located approximately 110 nucleotides downstream of the HTB1 gene, lead to a delay in the accumulation of the neo-HTB1 mRNA in the S phase and a lack of mRNA turnover in the G(2) phase. The DDE is transcribed as part of the primary transcript and binds a protein factor(s). Maximum binding is observed in the S phase of the cell cycle, and mutations that affect the turnover of the HTB1 mRNA alter the binding activity. While located in the same general region, mutations that affect 3'-end cleavage site selection act independently from those that alter the cell cycle regulation.


Figures

FIG. 1.
FIG. 1.
(A) S1 nuclease protection of the neo-HTB1 gene: schematic representation of the gene. The gene contains the bacterial neomycin phosphotransferase open reading frame under the control of the GAL1 promoter. The SphI-HindIII fragment of the HTB1 gene was inserted at the BamHI and HindIII sites as shown. The shaded box represents the 17 amino acids of the coding sequence of HTB1. The positions of the restriction enzyme sites are numbered relative to the position of the first base of the neomycin translation start codon (+1). The region between the BamHI site (at position +848) and the shaded box contains 157 bp of extraneous DNA. BLAST analysis of this sequence revealed it to be a repeat of the region surrounding the neo transcription start site. The line below BamHI and StyI sites shows the region used as a DNA probe for S1 nuclease mapping. The probe was labeled with [α-32P]dATP at the BamHI site. Total RNA (isolated from yeast cells grown in galactose and transformed with the plasmid pLJ31-HTB1) was hybridized with the DNA probe. Following digestion with S1 nuclease, the samples were electrophoresed through a 6% denaturing polyacrylamide gel alongside a sequencing ladder. Dideoxy sequencing of the BamHI-StyI fragment was carried out by using a primer from the BamHI region (Table 1). The same S1 protection pattern was observed in three independent experiments. (B) Sequences surrounding the HTB1 mRNA 3′ end. The nucleotide immediately after the stop codon of the HTB1 gene is labeled as +1. ∗∗, neo-HTB1 cleavage sites; ^^, endogenous HTB1 cleavage sites. The underlined sequence represents the 17 amino acids of HTB1 coding sequence. The numbers above the sequence are designated relative to the position of the stop codon of the HTB1 gene. The boxed regions show the purine-rich sequences downstream of the HTB1 gene.
FIG. 2.
FIG. 2.
Northern blot analysis of neo-HTB1 transcripts from mutants in the downstream sequences of the HTB1 gene. (A) Schematic representation of the neo-HTB1 gene. The shaded box represents the 17 amino acids of the HTB1 gene. The region of the neo gene used as a DNA probe for Northern blot hybridization is indicated. The cleavage sites are indicated by arrows. The open box shown downstream of the cleavage sites indicates the location where mutations were made. The region is shown in expanded form in the lower panel and numbered relative to the position of the stop codon of the HTB1 gene. The WT sequences where mutations took place are underlined. The introduced mutations and the names of the mutants are shown below the sequence. (B) Northern blot hybridization of total RNA from each mutant probed with the neo-specific probe. Lane 1, pLJ31-HTB1 grown in glucose; lane 2, pLJ31-HTB1 grown in galactose. All mutants were grown in galactose. The full-length neo-HTB1 transcript is marked with a solid arrow, while the minor transcript, which was detected with the neo probe only, is indicated by an open arrowhead. Transcripts detected in mutants pSAC10, -11, and -16 are labeled Transcript A and Transcript B and are indicated by a double solid arrowhead and single solid arrowhead, respectively. The Northern blot patterns were independently observed in at least three independent experiments.
FIG. 3.
FIG. 3.
S1 nuclease mapping of the 3′ end of neo-HTB1 generated by mutant genes. Total RNA was isolated from yeast cells grown in galactose-containing medium and transformed with the WT or mutant plasmids. RNA was hybridized with a DNA probe labeled with [α-32P]dATP. (A) Schematic representation of the neo-HTB1 transcript, showing the position of the DNA probe. The values above the BamHI and StyI sites represent their positions relative to that of the neomycin translation start codon. Following digestion with S1 nuclease, samples were electrophoresed through a 6% denaturing polyacrylamide gel. Lane 1, pLJ31-HTB1 grown in glucose; lane 2, pLJ31-HTB1 grown in galactose; lane 3, pSAC10; lane 4, pSAC11; lane 5, pSAC17; lane 6, pSAC13; lane 7, pSAC14; lane 8, pSAC20; lane 9, pSAC21. All mutants were grown in galactose. The four protected fragments are labeled 1∗∗, 2∗∗, 3∗∗, and 4∗∗. The position of a 311-nt molecular mass marker is shown on the left of the figure. The S1 cleavage pattern was observed in at least two independent experiments. (B) S1 nuclease mapping of mutants pSAC10, -11, and -16. Total RNA was hybridized with an antisense DNA probe labeled at the 3′ end with [α-32P]dATP. Diagrammatic representation of the neo-HTB1 transcript showing the region of the StyI-ScaI DNA probe. The probe was labeled at the StyI site. The multiple arrows show the position of the normal cleavage sites, while the single arrow shows the position of the new cleavage sites observed with mutants pSAC10, -11, and -16. Protected fragments were electrophoresed through a 6% denaturing polyacrylamide gel. Lane 1, WT pLJ31-HTB1-transformed cells grown in glucose; lane 2, WT pLJ31-HTB1-transformed cells grown in galactose; lane 3, pSAC10; lane 4, pSAC11; lane 5, pSAC16; lane P, probe alone; lane M, HaeIII-cut φX174 DNA ladder. All mutants were grown in galactose. The S1 cleavage pattern was observed in at least two independent experiments. (C) Sequences surrounding the new cleavage sites in mutants pSAC10, -11, and -16 are shown. The schematic representation of the neo-HTB1 gene is shown as outlined in the upper half of panel B. The single vertical arrow shows the location of the new cleavage site immediately downstream of the BamHI site. The sequence in this region is shown in expanded form below the schematic representation. The BamHI site is represented by underlined bold letters. The final nucleotide represents the cleavage site.
FIG. 3.
FIG. 3.
S1 nuclease mapping of the 3′ end of neo-HTB1 generated by mutant genes. Total RNA was isolated from yeast cells grown in galactose-containing medium and transformed with the WT or mutant plasmids. RNA was hybridized with a DNA probe labeled with [α-32P]dATP. (A) Schematic representation of the neo-HTB1 transcript, showing the position of the DNA probe. The values above the BamHI and StyI sites represent their positions relative to that of the neomycin translation start codon. Following digestion with S1 nuclease, samples were electrophoresed through a 6% denaturing polyacrylamide gel. Lane 1, pLJ31-HTB1 grown in glucose; lane 2, pLJ31-HTB1 grown in galactose; lane 3, pSAC10; lane 4, pSAC11; lane 5, pSAC17; lane 6, pSAC13; lane 7, pSAC14; lane 8, pSAC20; lane 9, pSAC21. All mutants were grown in galactose. The four protected fragments are labeled 1∗∗, 2∗∗, 3∗∗, and 4∗∗. The position of a 311-nt molecular mass marker is shown on the left of the figure. The S1 cleavage pattern was observed in at least two independent experiments. (B) S1 nuclease mapping of mutants pSAC10, -11, and -16. Total RNA was hybridized with an antisense DNA probe labeled at the 3′ end with [α-32P]dATP. Diagrammatic representation of the neo-HTB1 transcript showing the region of the StyI-ScaI DNA probe. The probe was labeled at the StyI site. The multiple arrows show the position of the normal cleavage sites, while the single arrow shows the position of the new cleavage sites observed with mutants pSAC10, -11, and -16. Protected fragments were electrophoresed through a 6% denaturing polyacrylamide gel. Lane 1, WT pLJ31-HTB1-transformed cells grown in glucose; lane 2, WT pLJ31-HTB1-transformed cells grown in galactose; lane 3, pSAC10; lane 4, pSAC11; lane 5, pSAC16; lane P, probe alone; lane M, HaeIII-cut φX174 DNA ladder. All mutants were grown in galactose. The S1 cleavage pattern was observed in at least two independent experiments. (C) Sequences surrounding the new cleavage sites in mutants pSAC10, -11, and -16 are shown. The schematic representation of the neo-HTB1 gene is shown as outlined in the upper half of panel B. The single vertical arrow shows the location of the new cleavage site immediately downstream of the BamHI site. The sequence in this region is shown in expanded form below the schematic representation. The BamHI site is represented by underlined bold letters. The final nucleotide represents the cleavage site.
FIG. 4.
FIG. 4.
The DDE is transcribed as part of the primary transcript. (A) Schematic representation of the HTB1 region of the neo-HTB1 gene, showing the position of the 200-nt DNA fragments to which nascent RNA was hybridized. The fragments are labeled Probe 1 to Probe 4. The values above the poly(A) sites show their positions relative to that of the stop codon of HTB1 (+1). The shaded box represents the HTB1 coding sequences, while the open box downstream of the poly(A) sites (arrows) represents the DDE. (B) Hybridization of nascent transcripts from yeast cells transformed with the WT plasmid pLJ31-HTB1 grown in glucose or galactose. M13, single-stranded phage DNA with no insert. Probes 1 to 4 were as described for panel A.
FIG. 5.
FIG. 5.
Cell cycle regulation of the neo-HTB1 transcript. Yeast cells transformed with the plasmid pLJ31-HTB1 or mutant plasmids were synchronized to the G1 phase of the cell cycle by the addition of the α1-mating factor. RNA was extracted at 5-min intervals and hybridized to a probe specific for the coding region of the HTB1 gene (A) (Table 1) or a neo-specific probe (B to E) (Fig. 2A and Table 1). To account for slight variations in RNA loading, the blots were stripped and rehybridized with an actin DNA probe. The levels of hybridization to the three probes were quantified, normalized to the actin mRNA levels, and expressed as mRNA levels at each time point relative to the level of hybridization at 20 min following removal of α1-mating factor (right panels). (A) Levels of endogenous HTB1 mRNA; (B) mRNA levels of WT neo-HTB1; (C) mRNA levels of neo-HTB1 from cells transformed with mutant pSAC14 plasmid; (D) mRNA levels of neo-HTB1 from cells transformed with mutant pSAC20 plasmid; (E) mRNA levels of neo-HTB1 from cells transformed with mutant pSAC21 plasmid. The numbers above each lane indicate the time (min) after release from α1-factor. The hybridization patterns shown in each panel were independently observed in at least three experiments.
FIG. 6.
FIG. 6.
A protein factor binds to the DDE. (A) Schematic representation of the neo-HTB1 gene. The shaded box represents the region of the last 17 amino acids of the HTB1 gene. The arrows indicate the locations of the cleavage sites. The open box represents the location of the DDE. The sequences within the DDE are shown in expanded form below the schematic representation. Underlined sequences represent the forward and reverse primers used to amplify the DDE sequences. T7 promoter sequences are shown in bold letters. (B) RNA corresponding to the sequence shown in panel A was radiolabeled by incorporation of [α-32P]UTP. The RNA was incubated with cell extracts prepared at the times (min) indicated following release from α1-factor synchronization. Following the incubation, the samples were electrophoresed through a 4% nondenaturing acrylamide gel. Lane 1, RNA probe alone; lanes 2 to 4, cell extract prepared 30 min after release from α-factor arrest; lanes 5 and 6, 35-min extract; lanes 7 to 9, 40-min extract; lanes 10 to 12, 45-min extract. Increasing concentrations (10, 20, and 40 μg) of cell extracts were used per 20 μl of reaction mixture. Lanes 2, 5, 7, and 10, 10 μg of extract; lanes 3, 8, and 11, 20 μg; lanes 4, 6, 9, and 12, 40 μg. The band shift pattern was observed in at least three independent experiments. (C) RNA probes corresponding to the WT, pSAC14, pSAC20, and pSAC21 sequences were in vitro transcribed and labeled with [α32P]UTP. The RNA was incubated with cell extract prepared 35 min after release from α1-factor. Lanes 1 to 3, WT probe with 10, 20, and 40 μg of extract, respectively; lanes 4 to 6, pSAC14 probe with 10, 20, and 40 μg of extract, respectively; lanes 7 to 9, pSAC20 with 10, 20, and 40 μg of extract, respectively; lanes 10 to 12, pSAC21 with 10, 20, and 40 μg of extract, respectively. The arrow shows the position of band-shifted RNA. The band shift pattern was observed in at least three independent experiments.
FIG. 7.
FIG. 7.
Putative secondary structure for the region encompassing the DDE. The sequence surrounding the DDE was folded into a secondary structure by using the program MFOLD. Arrows show the positions of nucleotides altered in the various mutants. The numbers next to the structure represent the positions of the bases relative to that of the stop codon of the HTB1 gene (Fig. 1B).

Similar articles

Cited by

References

    1. Aranda, A., J. E. Perez-Ortin, C. Moore, and M. del Olmo. 1998. Transcription termination downstream of the Saccharomyces cerevisiae FBP1 poly(A) site does not depend on efficient 3′ end processing. RNA 4:303-318. - PMC - PubMed
    1. Aranda, A., and N. Proudfoot. 2001. Transcriptional termination factors for RNA polymerase II in yeast. Mol. Cell 7:1003-1011. - PubMed
    1. Barilla, D., B. A. Lee, and N. J. Proudfoot. 2001. Cleavage/polyadenylation factor IA associates with the carboxyl-terminal domain of RNA polymerase II in Saccharomyces cerevisiae. Proc. Natl. Acad. Sci. USA 98:445-450. - PMC - PubMed
    1. Battle, D. J., and J. A. Doudna. 2001. The stem-loop binding protein forms a highly stable and specific complex with the 3′ stem-loop of histone mRNAs. RNA 7:123-132. - PMC - PubMed
    1. Birse, C. E., L. Minvielle-Sebastia, B. A. Lee, K. Keller, and N. Proudfoot. 1998. Coupling transcriptional termination to messenger RNA maturation in yeast. Science 280:298-301. - PubMed

Publication types

MeSH terms

Substances

LinkOut - more resources