. 2002 Dec;22(24):8426-37.
doi: 10.1128/MCB.22.24.8426-8437.2002.

Developmental changes in the Sciara II/9A initiation zone for DNA replication

Affiliations

Developmental changes in the Sciara II/9A initiation zone for DNA replication

Victoria V Lunyak et al. Mol Cell Biol. 2002 Dec.

Abstract

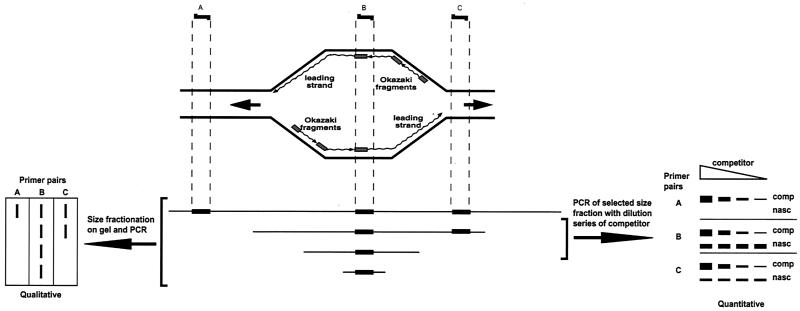
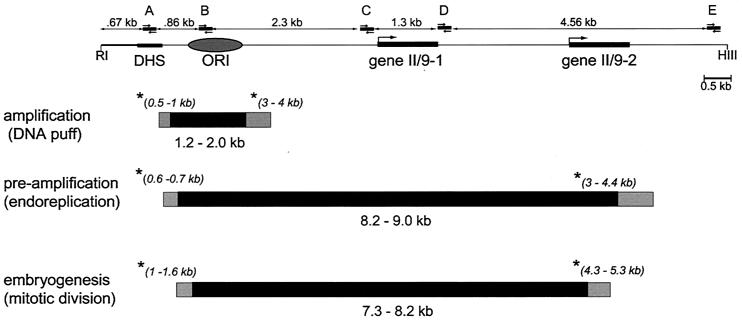
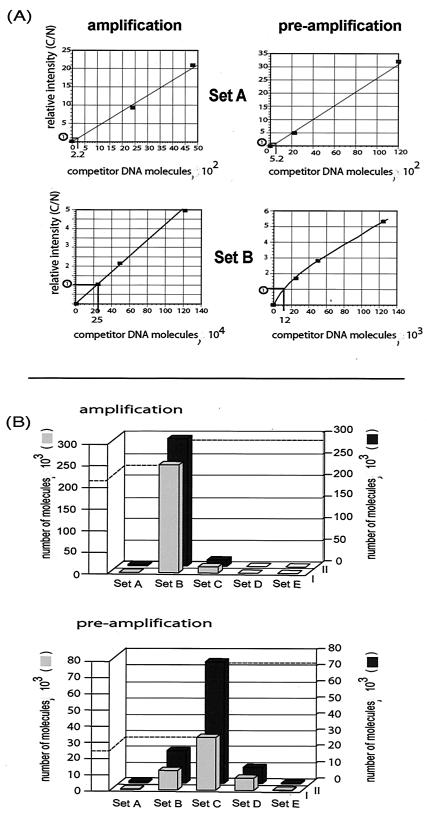
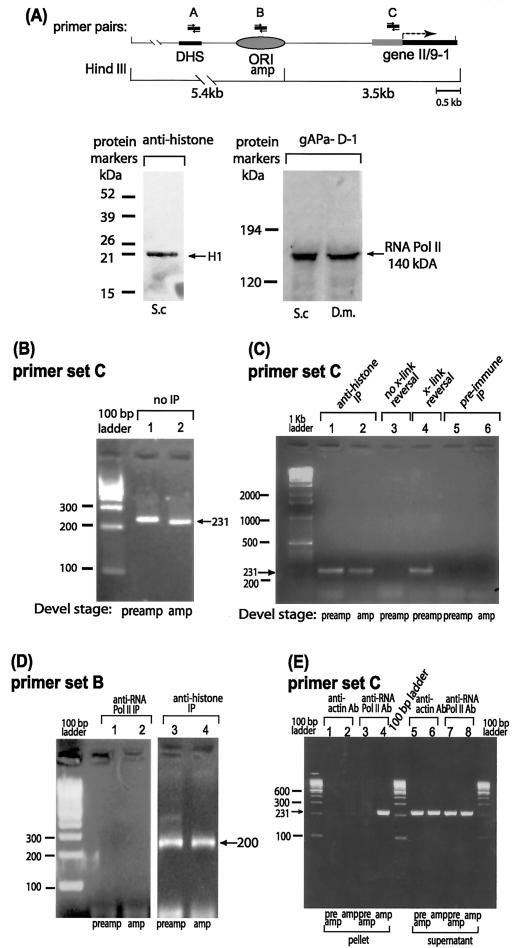
Developmentally regulated initiation of DNA synthesis was studied in the fly Sciara at locus II/9A. PCR analysis of nascent strands revealed an initiation zone that spans approximately 8 kb in mitotic embryonic cells and endoreplicating salivary glands but contracts to 1.2 to 2.0 kb during DNA amplification of DNA puff II/9A. Thus, the amplification origin occurs within the initiation zone used for normal replication. The initiation zone left-hand border is constant, but the right-hand border changes during development. Also, there is a shift in the preferred site for initiation of DNA synthesis during DNA amplification compared to that in preamplification stages. This is the first demonstration that once an initiation zone is defined in embryos, its borders and preferred replication start sites can change during development. Chromatin immunoprecipitation showed that the RNA polymerase II 140-kDa subunit occupies the promoter of gene II/9-1 during DNA amplification, even though intense transcription will not start until the next developmental stage. RNA polymerase II is adjacent to the right-hand border of the initiation zone at DNA amplification but not at preamplification, suggesting that it may influence the position of this border. These findings support a relationship between the transcriptional machinery and establishment of the replication initiation zone.


Figures

FIG. 1.
FIG. 1.
Qualitative and quantitative methods to determine regions where DNA synthesis starts. The schematic drawing shows a replication bubble with nascent DNA comprised of the leading strand (continuous synthesis) and the lagging strand (discontinuous Okazaki fragment synthesis and ligation). An asynchronous population of replicating molecules results in replication bubbles of all sizes from each replicon. Nascent DNA is enriched and then separated according to size by alkaline gel electrophoresis. PCR is performed on each size fraction with primer pairs (A to C) from the area of interest. In the qualitative approach (96) (lower left of diagram), all three primer pairs form a product when using the longest nascent DNA as a template, but only primer pair B forms a product from the smallest nascent DNA. In the quantitative approach, a size fraction of nascent DNA is selected for use in competitive PCR (30), using a range of known concentrations of the competitor. The concentration where the product of the competitor is the same as the nascent DNA indicates the concentration of the latter. See the text for further details.
FIG. 2.
FIG. 2.
The initiation zone for replication at locus II/9A changes during development. (Top) Map of locus II/9A in Sciara. The DHS occurs concurrently with replication (94), ORI designates the 1-kb amplification origin mapped by 2D and 3D gels (59, 60), and genes II/9-1 and II/9-2 are transcription units from this locus (27). The positions of the five primer pairs (A to E) are shown, as are EcoRI (RI) and HindIII (HIII) restriction sites that flank this 11-kb region. (Bottom) Schematic drawings of the initiation zones calculated from data in Fig. 3. The nascent DNA fractions used to calculate the boundaries of the initiation zones are marked with an asterisk, and the nascent DNA size of that fraction is shown in parentheses. The black area is the initiation zone if the higher value for the smallest detectable nascent DNA is used for the calculation, whereas the gray area delimits the initiation zone calculated from the lower value for the smallest detectable nascent DNA.
FIG. 3.
FIG. 3.
PCR analysis of nascent strand length from the II/9A locus of Sciara. (A) PCR analysis of nascent strand length at locus II/9A from various developmental stages in Sciara: DNA amplification stage to form DNA puffs in the salivary gland polytene chromosomes (upper panel), preamplification stage salivary glands where endoreplication results in polytenization of the chromosomes (middle panel), and 9-h embryos where mitotic division in cycle 11 occurs (lower panel). Selected size fractions of nascent DNA were pooled and assayed by PCR. Photographs of ethidium bromide-stained agarose gels show the PCR products from nascent strands; the length of nascent DNA in each fraction is indicated. The fractions where a PCR product was obtained from the smallest nascent DNA are marked with an asterisk and were used to estimate the boundaries of the initiation zone (Fig. 2). The pale band seen with primer pair A for the 0.2- to 0.3-kb size fraction of nascent DNA from embryos most likely is due to contamination from unligated Okazaki fragments. The positions of primer sets A to E are shown on Fig. 2. The lanes marked M contain a 100-bp DNA size marker (Gibco-BRL/Life Technologies). (B) Lane 1 of each panel contains a 100-bp size marker (Gibco-BRL/Life Technologies). Lane 2 of each panel shows the efficiency of the indicated primer pair (A to E) in amplifying 20 ng of chromosomal DNA under the same experimental conditions used above in panel A. The size of the PCR product from each primer set is indicated.
FIG. 4.
FIG. 4.
PCR analysis of nascent strand abundance at the Sciara II/9A locus. Nascent DNA from amplification or preamplification stage Sciara salivary glands was fractionated by alkaline agarose gel electrophoresis. Small nascent DNA (N) of 860 to 900 bp (shown here) or 1,500 to 1,570 bp (data not shown) was mixed with increasing amounts of competitor DNA (C) (the number of competitor DNA molecules is indicated) and coamplified by PCR with primer sets A to E. The PCR products were resolved on a 4% MetaPhor agarose gel and stained with ethidium bromide, and the intensity of each band was quantified to allow calculation of the number of small nascent strand DNA molecules (n) per five salivary gland equivalents.
FIG. 5.
FIG. 5.
Preferred initiation site for DNA synthesis changes during development. (A) The relative intensity of the competitor and nascent DNA bands (C/N) (see Fig. 4) is plotted against the number of competitor DNA molecules. The point on this linear relationship where C/N = 1 is indicated. (B) The number of nascent DNA molecules (n in Fig. 4) is plotted against primer sets A to E (the distance between primer sets is not drawn to scale; refer to Fig. 2 marking the primer sets on a map of the II/9A locus). The calculated values of small nascent strand abundance are shown for amplification and preamplification stages for nascent DNA fractions of 860 to 900 bp (gray boxes) or 1,500 to 1,570 bp (black boxes). The relatively greater number of nascent DNA molecules detected by primer set C at preamplification stage (black compared to gray boxes) could reflect initiation from an origin not centered at primer set C and present in the 1,500- to 1,570-bp fraction but not in the 860- to 900-bp fraction.
FIG. 6.
FIG. 6.
ChIP reveals in vivo occupancy by RNA polymerase II near the right-hand border of the initiation zone for DNA amplification. (A) Map of the region of interest in locus II/9A of Sciara, with PCR primer sets A to C indicated. Other details of the map are the same as in Fig. 2. Sites cleaved by HindIII are shown below the map. Western blots are shown for reaction of protein from S. coprophila (S.c.) or D. melanogaster (D.m.) larval homogenate with antibody against the 140-kDa subunit of RNA polymerase II (gAPα-D1) or histones. Only histone H1 is detected in 0.5 M NaCl extracted material. (B to E) Gel electrophoresis of ethidium bromide-stained PCR products with primer set C (panels B, C, and E) or primer set B (panel D) after ChIP with the antibody shown or after the indicated control treatments.

Similar articles

Cited by

References

    1. Abdurashidova, G., M. Deganuto, R. Klima, S. Riva, G. Biamonti, M. Giacca, and A. Falaschi. 2000. Start sites of bidirectional DNA synthesis at the human lamin B2 origin. Science 287:2023-2026. - PubMed
    1. Aladjem, M. I., M. Groudine, L. L. Brody, E. S. Dieken, R. E. Fournier, G. M. Wahl, and E. M. Epner. 1995. Participation of the α-globin locus control region in initiation of DNA replication. Science 270:815-819. - PubMed
    1. Aladjem, M. I., W. Rodewald, J. L. Kolman, and G. M. Wahl. 1998. Genetic dissection of a mammalian replicator in the human beta-globin locus. Science 281:1005-1009. - PubMed
    1. Altman, A. L., and E. Fanning. 2001. The Chinese hamster dihydrofolate reductase replication origin beta is active at multiple ectopic chromosomal locations and requires specific DNA sequence elements for activity. Mol. Cell. Biol. 21:1098-1110. - PMC - PubMed
    1. Austin, R. J., T. L. Orr-Weaver, and S. P. Bell. 1999. Drosophila ORC specifically binds to ACE3, an origin of DNA replication control element. Genes Dev. 13:2639-2649. - PMC - PubMed

Publication types

LinkOut - more resources