. 2002 Dec;22(24):8539-51.
doi: 10.1128/MCB.22.24.8539-8551.2002.

Early B-cell factor, E2A, and Pax-5 cooperate to activate the early B cell-specific mb-1 promoter

Affiliations

Early B-cell factor, E2A, and Pax-5 cooperate to activate the early B cell-specific mb-1 promoter

Mikael Sigvardsson et al. Mol Cell Biol. 2002 Dec.

Abstract

Previous studies have suggested that the early-B-cell-specific mb-1(Igalpha) promoter is regulated by EBF and Pax-5. Here, we used in vivo footprinting assays to detect occupation of binding sites in endogenous mb-1 promoters at various stages of B-cell differentiation. In addition to EBF and Pax-5 binding sites, we detected occupancy of a consensus binding site for E2A proteins (E box) in pre-B cells. EBF and E box sites are crucial for promoter function in transfected pre-B cells, and EBF and E2A proteins synergistically activated the promoter in transfected HeLa cells. Other data suggest that EBF and E box sites are less important for promoter function at later stages of differentiation, whereas binding sites for Pax-5 (and its Ets ternary complex partners) are required for promoter function in all mb-1-expressing cells. Using DNA microarrays, we found that expression of endogenous mb-1 transcripts correlates most closely with EBF expression and negatively with Id1, an inhibitor of E2A protein function, further linking regulation of the mb-1 gene with EBF and E2A. Together, our studies demonstrate the complexity of factors regulating tissue-specific transcription and support the concept that EBF, E2A, and Pax-5 cooperate to activate target genes in early B-cell development.


Figures
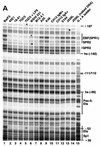
FIG. 1.
FIG. 1.
In vivo footprinting analysis of the mb-1 promoter sense strand. Cell lines indicated at top were treated with DMS and cleaved with piperidine prior to amplification of mb-1 promoter sense strand cleavage products by using ligation-mediated PCR. (A) Protection and cleavage of sense strand between −39 and −197. Protected regions and approximate locations of factor binding sites are indicated at right. SPR sense strand protected region. (B) Histograms of cleavage products detected in panel A. Histograms shown for lanes 1 (Ba/F3), 3 (18-81), 8 (A20), 12 (S194), and 14 (J558L naked DNA) were prepared by using ImageQuant software (Molecular Dynamics). All plots are shown to the same scale. Significant differences between peak intensities are highlighted. Factor binding sites and/or sense strand protected regions are indicated above. Note reduced signals at EBF/SPR1, SPR2, and SPR3 sites only in 18-81 cells. Hypersensitivity at −86 is detected in 18-81 and A20 cells. Proximal Ets site (−53/−52) is protected in 18-81, less so in A20 cells. (C) Protection and cleavage products of sense strand between −123 and −197. (D) Histograms of cleavage products detected in panel C. Histograms are shown for lanes 2, 3, and 4.
FIG. 1.
FIG. 1.
In vivo footprinting analysis of the mb-1 promoter sense strand. Cell lines indicated at top were treated with DMS and cleaved with piperidine prior to amplification of mb-1 promoter sense strand cleavage products by using ligation-mediated PCR. (A) Protection and cleavage of sense strand between −39 and −197. Protected regions and approximate locations of factor binding sites are indicated at right. SPR sense strand protected region. (B) Histograms of cleavage products detected in panel A. Histograms shown for lanes 1 (Ba/F3), 3 (18-81), 8 (A20), 12 (S194), and 14 (J558L naked DNA) were prepared by using ImageQuant software (Molecular Dynamics). All plots are shown to the same scale. Significant differences between peak intensities are highlighted. Factor binding sites and/or sense strand protected regions are indicated above. Note reduced signals at EBF/SPR1, SPR2, and SPR3 sites only in 18-81 cells. Hypersensitivity at −86 is detected in 18-81 and A20 cells. Proximal Ets site (−53/−52) is protected in 18-81, less so in A20 cells. (C) Protection and cleavage products of sense strand between −123 and −197. (D) Histograms of cleavage products detected in panel C. Histograms are shown for lanes 2, 3, and 4.
FIG. 2.
FIG. 2.
In vivo footprinting analysis of the mb-1 promoter antisense strand. Cell lines indicated at top were treated with DMS and cleaved with piperidine prior to amplification of mb-1 promoter antisense strand cleavage products by using ligation-mediated PCR (see Materials and Methods). (A) Protection and cleavage of antisense strand between −188 and −97. Protected regions and approximate locations of factor binding sites are indicated at right. APR antisense strand protected region. (B) Histograms of cleavage products detected in panel A. See Fig. 1B for details. Histograms are shown for lanes 2, 4, 9, 13, and 15. Note reduced signals in 18-81 cells at EBF/APR1, APR2, and APR3. (C) Protection and cleavage products of antisense strand between −122 and −48. Guanines discussed in the text are indicated at left. The guanine at −74 is hypersensitive to DMS modification in mb-1-expressing cells. (D) Histograms of cleavage products detected in panel C. Histograms are shown for lanes 2, 4, 9, 13, and 15. The bipartite paired domain of Pax-5 makes two sets of contacts.
FIG. 3.
FIG. 3.
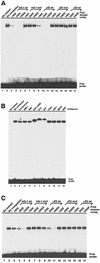
Specific binding of nuclear extract and recombinant E2A proteins to an mb-1 promoter distal region (−136 to −157) probe in vitro. All complexes were detected by using a Molecular Dynamics PhosphorImager. (A) Binding of B-cell nuclear extract proteins to the mb-1 distal region is specifically inhibited by wild type, but not mutated mb-1 promoter sequences. EMSA was performed by incubating 2 μg of crude 40E1 pre-B-cell nuclear protein with the promoter probe in the presence of increasing amounts of unlabeled double-stranded oligonucleotides as shown prior to fractionation on a nondenaturing polyacrylamide gel. Mutated (mut) competitors have a single base change in the E2A consensus site (5′-CAGGTG to 5′-CTGGTG). (B) E2A-specific antisera supershift mb-1 promoter distal region complexes. EMSA was performed as in panel A, except that specific antisera were included (at 1:50 final dilution) during binding reactions.(C) Binding of recombinant E47 to the mb-1 promoter distal region. Hamster E47 (Pan-1) DNA-binding domain (residues 518 to 649) was synthesized by translating synthetic RNA in vitro by using reticulocyte lysates. Binding reactions were performed with 2-μl lysates as shown. “No RNA” indicates unprogrammed lysate. DNA competitors and concentrations are identical to those used in panel A.
FIG. 4.
FIG. 4.
Protection of sequences from DMS in footprinting assays correlates with requirements for mb-1 promoter activity in transfected cells. (A) Summary of results from in vivo footprinting and mb-1 promoter mutations tested in panel B. Sequences of the murine mb-1 promoter (−197 to +29, including the translational start codon) are shown with previously mapped sites of transcriptional initiation (47). Approximate binding sites for factors are labeled above and underlined between strands. Guanines and adenines protected in footprinting assays are indicated by open circles for each strand. Guanines showing enhanced cleavage (hypersensitivity) are indicated by closed circles. Mutations tested in panel B (relative to sense strand sequences) are indicated below sequences as lowercase case letters. (B) Functional requirements for mb-1 promoter factor binding sites in transfected cells. Plasmids with wild-type or mutated mb-1 promoter sequences (as in panel A) indicated at left were introduced into Ba/F3 pro-B cells, 18-81 pre-B cells, or A20 lymphoma cells in short-term transfection assays as shown. Luciferase activities were determined relative to the TATA plasmid control (see Materials and Methods) and represent the means of three experiments.
FIG. 5.
FIG. 5.
Expression and DNA-binding activities of E2A, EBF, and Pax-5 proteins in cell lines. (A) Western analysis of protein expression in representative cell lines. Similar numbers of Ba/F3 pro-B, 18-81 pre-B, A20 lymphoma, or S194 plasmacytoma cells were lysed, and proteins were electrophoresed on SDS-PAGE gels. Proteins were Western blotted and probed with antibodies specific for E2A, EBF, or Pax-5. (B) EMSA analysis of Oct-1, Pax-5, E2A, and EBF DNA-binding activities in B-cell line nuclear extracts. Binding of similar amounts of nuclear extract proteins was tested by using 32P-labeled probes.
FIG. 6.
FIG. 6.
EBF and E47 synergistically activate the mb-1 promoter in transfected HeLa cells. Luciferase reporter plasmids with wild-type or mutated promoters were cotransfected with plasmids for expression of full-length murine EBF, full-length hamster E47 (Pan-1), or E47(407-649) as indicated below. The Δdistal promoter, which lacks mb-1 promoter sequences upstream of the NdeI site (at −112; deleted sequences include the EBF and E2A binding sites) was tested by itself or with coexpressed EBF and E47. All values were normalized to cotransfected Renilla luciferase activity and represent the means of four experiments.
FIG. 7.
FIG. 7.
DNA binding by EBF and E47. EMSA was performed by using a labeled mb-1 promoter probe (−183 to −140), recombinant EBF(24-429), and recombinant E47(518-649) as indicated above. EBFx4 indicates a higher-order complex of EBF homodimers, likely tetramers (17). EBF:E47 indicates a band that appears only when EBF and E47 are combined. We included 1,000-fold excess oligonucleotides comprising the μE5 E2A binding site in lanes 6 and 12.

Similar articles

Cited by

References

    1. Alt, F. W., N. Rosenberg, R. J. Casanova, E. Thomas, and D. Baltimore. 1982. Immunoglobulin heavy chain class expression and class switching in a murine leukemia cell line. Nature 296:325-331. - PubMed
    1. Aronheim, A., R. Shiran, A. Rosen, and M. D. Walker. 1993. Cell-specific expression of helix-loop-helix transcription factors encoded by the E2A gene. Nucleic Acids Res. 21:1601-1606. - PMC - PubMed
    1. Ausubel, F. M., R. Brent, R. E. Kingston, D. D. Moore, J. G. Seidman, J. A. Smith, and K. Struhl. 1995. Current protocols in molecular biology. John Wiley & Sons, Inc., New York, N.Y.
    1. Bain, G., E. C. Maandag, D. J. Izon, D. Amsen, A. M. Kruisbeek, B. C. Weintraub, I. Krop, M. S. Schlissel, A. J. Feeney, M. van Roon, M. van der Valk, H. P. J. te Reile, A. Berns, and C. Murre. 1994. E2A proteins are required for proper B cell development and initiation of immunoglobulin gene rearrangements. Cell 79:885-892. - PubMed
    1. Beckmann, H., L. K. Su, and T. Kadesch. 1990. TFE3: a helix-loop-helix protein that activates transcription through the immunoglobulin enhancer muE3 motif. Genes Dev. 4:167-179. - PubMed

Publication types

MeSH terms