Review
. 2002 Dec;24(12):1130-44.
doi: 10.1002/bies.10193.

Complexity of calcium signaling in synaptic spines

Affiliations
Review

Complexity of calcium signaling in synaptic spines

Kevin M Franks et al. Bioessays. 2002 Dec.

Abstract

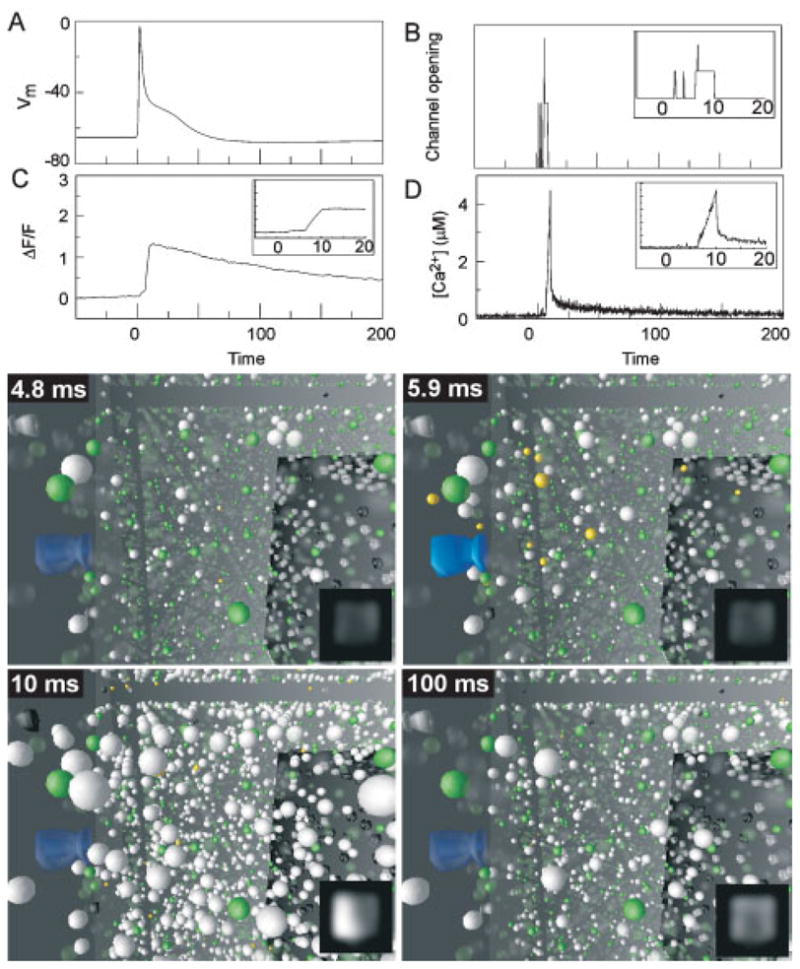
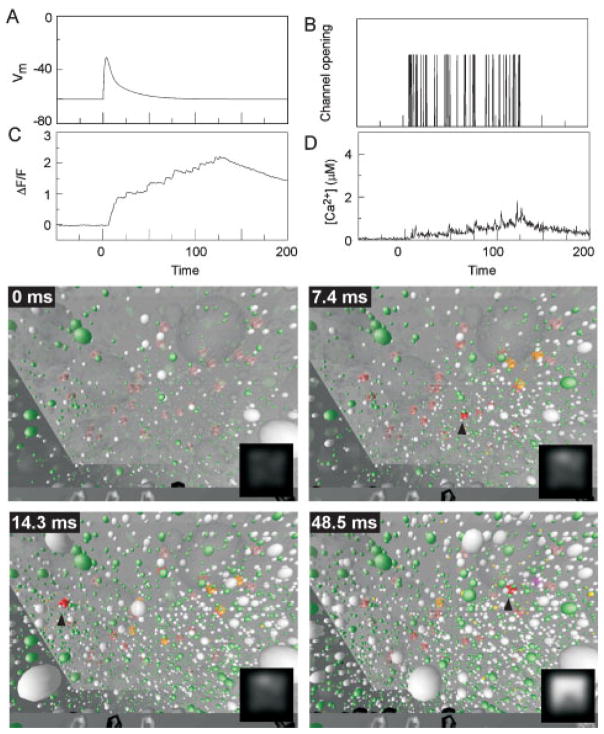
Long-term potentiation and long-term depression are thought to be cellular mechanisms contributing to learning and memory. Although the physiological phenomena have been well characterized, little consensus of their underlying molecular mechanisms has emerged. One reason for this may be the under-appreciated complexity of the signaling pathways that can arise if key signaling molecules are discretely localized within the synapse. Recent findings suggest an unanticipated degree of structural organization at the synapse, and improved methods in cellular imaging of living tissue have provided much-needed information about the intracellular dynamics of Ca(2+), thought to be critical for both LTP and LTD. In this review, we briefly summarize some of these developments, and show that a more complete understanding of cellular signaling depends on the successful integration of traditional biochemistry and molecular biology with the spatial and temporal details of synaptic ultrastructure. Biophysically realistic computer simulations can have an important role in bridging these disciplines.


Figures

Figure 1
Figure 1
Simple, schematic model of frequency-selective, Ca2+-dependent induction of LTP and LTD. A: After release from the presynaptic bouton, postsynaptic AMPARs bind transmitter (not shown), causing them to open, and allowing Na+ to enter the spine. Increased postsynaptic voltage, often due to temporally summating EPSCs, expels a Mg2+ ion from the pore of the NMDAR, thus allowing the transmitter-bound receptors to open. Unlike AMPARs, NMDARs allow passage of significant amounts of both Na+ and Ca2+ into the spine. Moderate increases in [Ca2+]i activate a signal transduction cascade, probably involving calcineurin, which results in the expression of LTD. At higher [Ca2+]i levels, a different pathway, probably involving CaMKII, results in the expression of LTP. B: [Ca2+]i increases with increasing frequency of synaptic stimulation. C: At very low stimulation frequencies, [Ca2+]i is too low to induce either LTP or LTD. At moderate frequencies (~1 Hz), the increase in [Ca2+]i is sufficient to induce LTD, but not LTP. Further increases in stimulation frequency result in LTP.
Figure 2
Figure 2
Selective induction of LTP and LTD depends on the order of pre- and postsynaptic pairing. A: Somatic current injections induced action potentials that resulted in EPSPs in synaptically coupled pyramidal cells. When current injections to two cells were presented 10 ms apart, the action potential preceded the EPSP by ~10 ms in one cell (post-before-pre, top trace), and followed the EPSP by ~10 ms in the other (pre-before-post spiking, bottom trace). B: Repeated pre-before-post (□) and post-before-pre correlated (■) spiking, resulted in LTP and LTD, respectively, when the pairing interval was 10 ms. Repeated paring at 100 ms did not result in any change in synaptic weight with pre-before-post (○) or post-before-pre (●) spiking. Reprinted with permission from Markram H, Lubke J, Frotscher M and Sakmann B. Science 1997;275:213–215. Copyright (1997) American Association for the Advancement of Science.
Figure 3
Figure 3
Fluorescent measurement of Ca2+ influx in spines and dendrites. A: Neuron filled with fluorescent Ca2+ indicator (left), and magnified view of the region outlined by the box showing an apical spine and its parent dendrite (middle). Right, line scan over the dendrite and spine head. Arrowhead, time when action potential was evoked by stimulation of soma. B: Average of transients in the spine and dendrite aligned with the somatic action potential. C: Sequence of frames (64 ms per frame) showing relative change in fluorescence due to Ca2+ influx through NMDA receptors during synaptic stimulation. A and B adapted from Sabatini BL and Svoboda K. Nature 2000;408:589–593 Copyright (2000) Macmillan Magazines Limited; C adapted from Mainen ZF, Malinow R and Svoboda K. Nature 1999;399:151–155 Copyright (1999) Macmillan Magazines Limited. Note that these data were collected with different concentrations of indicator, an exogenous calcium buffer, which distorts the size and shape of the Ca2+ transient.
Figure 4
Figure 4
Functional organization of the postsynaptic density. A: Schematic depiction showing components identified as being associated with the NMDA receptor signaling complex from a recent proteomics study(57) (light blue), together with previously identified scaffolding (dark blue) and signaling (yellow) proteins. B: Anatomical measurement of postsynaptic localization of signaling proteins using quantitative electron microscopy techniques. C: Expression of LTD switches to LTP with increasing stimulation frequency in CA1 synapses of normal mice (○). By contrast, PSD-95 knock-out mice express a robust LTP at all stimulation frequencies (●) A adapted from Sheng M and Lee SH. Nat Neurosci 2000;3:633–635 Copyright (2001) by the Society for Neuroscience. B adapted with permission from Valtschanoff JG and Weinberg RJ. J Neurosci 2001;21:1211–1217 Copyright (2001) by the Society for Neuroscience. C adapted from Migaud M, Charlesworth P, Dempster M, Webster LC, Watabe AM, Makhinson M, He Y, Ramsay MF, Morris RG, Morrison JH, O’Dell TJ and Grant SG. Nature 1998;396:433–439 Copyright (1998) Macmillan Magazines Limited.
Figure 5
Figure 5
Simulation and visualization of post-synaptic Ca2+ dynamics after an action potential at t = 0. A:Membrane voltagein thespine. B:Stochastic opening of VDCCs on the spine membrane. C: Change in ΔF/F with the spine measured as a single compartment. Inset shows ΔF/F steadily increasing while channel is open, then decaying slowly. Ordinate, same scale as main panel. D: Intracellular [Ca2+], defined by dividing the total number of free Ca2+ ions in the entire spine by its volume. Insets show [Ca2+]i steadily increasing while channel is open, then falling rapidly when channel closes. Ordinate, same scale as main panel. Panels show visualized model output at 4 times after the somatic current injection. Insets shows the simulated output expected from a fluorescence imaging experiment.
Figure 6
Figure 6
Simulation and visualization of post-synaptic Ca2+ influx after an EPSP evoked by transmitter release at t = 0. A: Membrane voltage in the spine. B: Rapid flickering of transmitter-bound NMDARs blocked and open/unblocked state. Prolonged influx of Ca2+ through spatially distinct receptors results in (C) a large fraction of bound indicator, but (D) low levels of free intracellular calcium. Panels show visualized model output at 4 times after release of transmitter. Insets shows the simulated output expected from a fluorescence imaging experiment.
Figure 7
Figure 7
[Ca2+]i and CaM activation depend on pairing frequency. (A,D) Percentage of different CBPs bound during 5 Hz and 10 Hz pairings, respectively. (B,E) Spine [Ca2+]i during 5 Hz and 10 Hz pairings, respectively, and (C,F) levels of CaM-4, respectively. Note that pairing at 10 Hz, but not 5 Hz, results in strong cooperativity from pairing-to-pairing. (G) Summary of the pairing frequency-dependence of CaM-4 with CBP concentrations (○, 200 μM; ◆, 100 μM; ▲, 400 μM). Adapted from Franks KM, Bartol TM, Jr. and Sejnowski TJ. Neurocomput 2001;38–40:9–16, with permission from Elsevier Science.

Similar articles

Cited by

References

    1. Churchland PS, Sejnowski TJ. The computational brain. Cambridge, Mass: MIT Press; 1992.
    1. Bliss TV, Collingridge GL. A synaptic model of memory:long-term potentiation in the hippocampus. Nature. 1993;361:31–39. - PubMed
    1. Bliss TV, Lomo T. Long-lasting potentiation of synaptic transmission in the dentate area of the anaesthetized rabbit following stimulation of the perforant path. J Physiol (Lond) 1973;232:331–356. - PMC - PubMed
    1. Sejnowski TJ. Statistical constraints on synaptic plasticity. J Theor Biol. 1977;69:385–389. - PubMed
    1. Bienenstock EL, Cooper LN, Munro PW. Theory for the development of neuron selectivity:orientation specificity and binocular interaction in visual cortex. J Neurosci. 1982;2:32–48. - PMC - PubMed

LinkOut - more resources