

Role of membrane fluidity in pressure resistance of Escherichia coli NCTC 8164
- PMID: 12450817
- PMCID: PMC134404
- DOI: 10.1128/AEM.68.12.5965-5972.2002
Role of membrane fluidity in pressure resistance of Escherichia coli NCTC 8164
Abstract
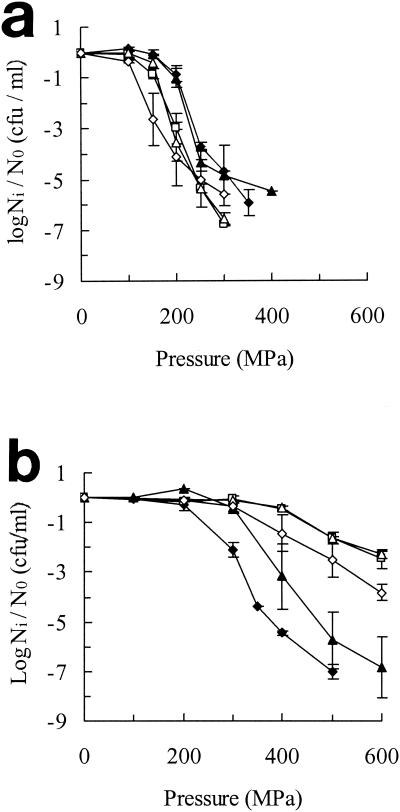
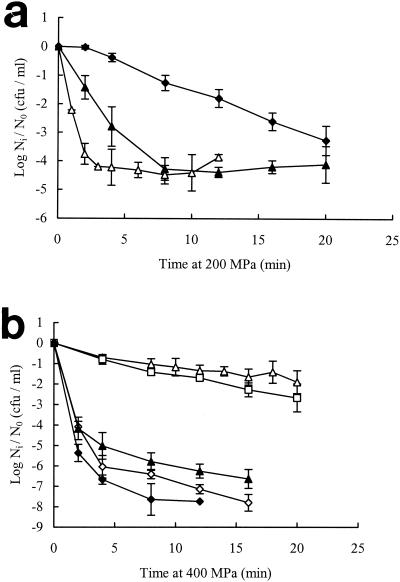
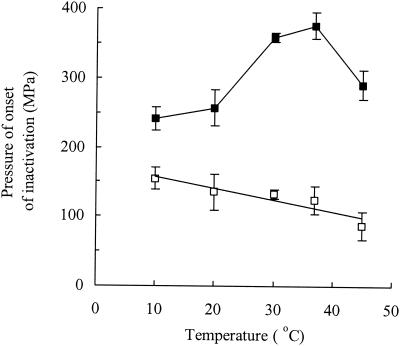
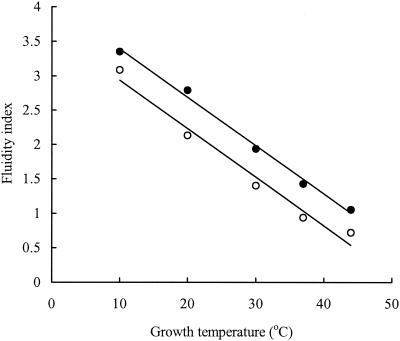
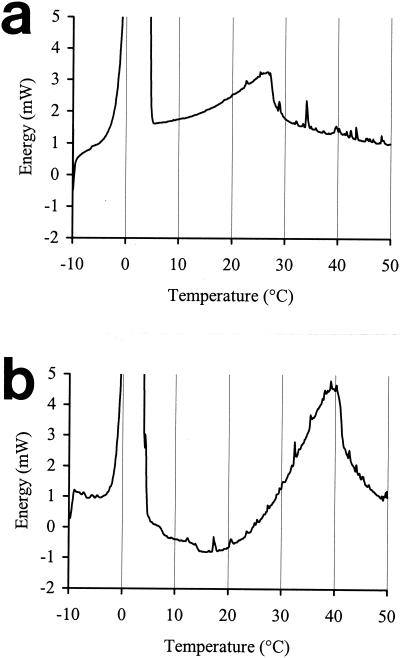
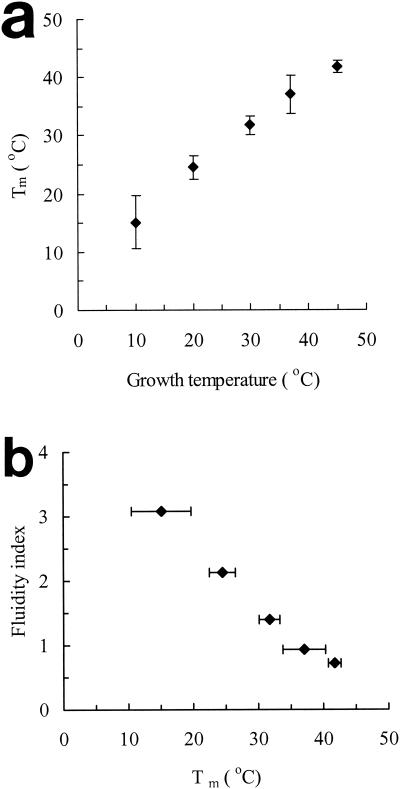
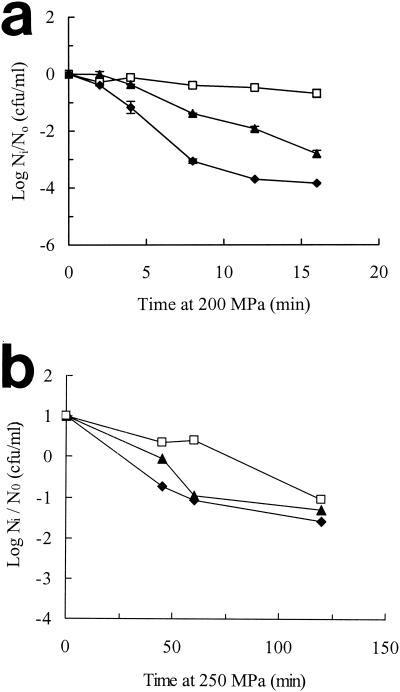
The relationship among growth temperature, membrane fatty acid composition, and pressure resistance was examined in Escherichia coli NCTC 8164. The pressure resistance of exponential-phase cells was maximal in cells grown at 10 degrees C and decreased with increasing growth temperatures up to 45 degrees C. By contrast, the pressure resistance of stationary-phase cells was lowest in cells grown at 10 degrees C and increased with increasing growth temperature, reaching a maximum at 30 to 37 degrees C before decreasing at 45 degrees C. The proportion of unsaturated fatty acids in the membrane lipids decreased with increasing growth temperature in both exponential- and stationary-phase cells and correlated closely with the melting point of the phospholipids extracted from whole cells examined by differential scanning calorimetry. Therefore, in exponential-phase cells, pressure resistance increased with greater membrane fluidity, whereas in stationary-phase cells, there was apparently no simple relationship between membrane fluidity and pressure resistance. When exponential-phase or stationary-phase cells were pressure treated at different temperatures, resistance in both cell types increased with increasing temperatures of pressurization (between 10 and 30 degrees C). Based on the above observations, we propose that membrane fluidity affects the pressure resistance of exponential- and stationary-phase cells in a similar way, but it is the dominant factor in exponential-phase cells whereas in stationary-phase cells, its effects are superimposed on a separate but larger effect of the physiological stationary-phase response that is itself temperature dependent.
Figures
References
-
- Apirakaramwong, A., J. Fukuchi. K. Kashiwagi, Y. Kakinuma, E. Ito, A. Ishihama, and K. Igarashi. 1998. Enhancement of cell death due to decrease in Mg2+ uptake by OmpC (cation-selective porin) deficiency in ribosome modulation factor-deficient mutant. Biochem. Biophys. Res. Commun. 251:482-487. - PubMed
-
- Baldassare, J. J., K. B. Rhinehart, and D. F. Silbert. 1976. Modification of membrane lipid: physical properties in relation to fatty acid structure. Biochemistry 15:2986-2994. - PubMed
-
- Baranyi, J., and T. A. Roberts. 1994. A dynamic approach to predicting bacterial growth in food. Int. J. Food Microbiol. 23:277-294. - PubMed
Publication types
MeSH terms
Substances
LinkOut - more resources
Full Text Sources
Molecular Biology Databases
