Comparative Study
. 2002 Dec 1;22(23):10153-62.
doi: 10.1523/JNEUROSCI.22-23-10153.2002.

Comparison of coupled and uncoupled currents during glutamate uptake by GLT-1 transporters

Affiliations
Comparative Study

Comparison of coupled and uncoupled currents during glutamate uptake by GLT-1 transporters

Dwight E Bergles et al. J Neurosci. .

Erratum in

  • J Neurosci. 2003 Jan 15;23(2):726.

Abstract

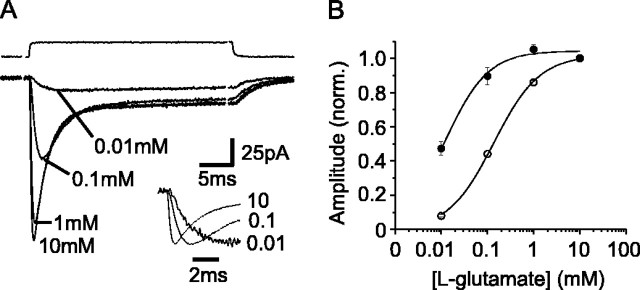
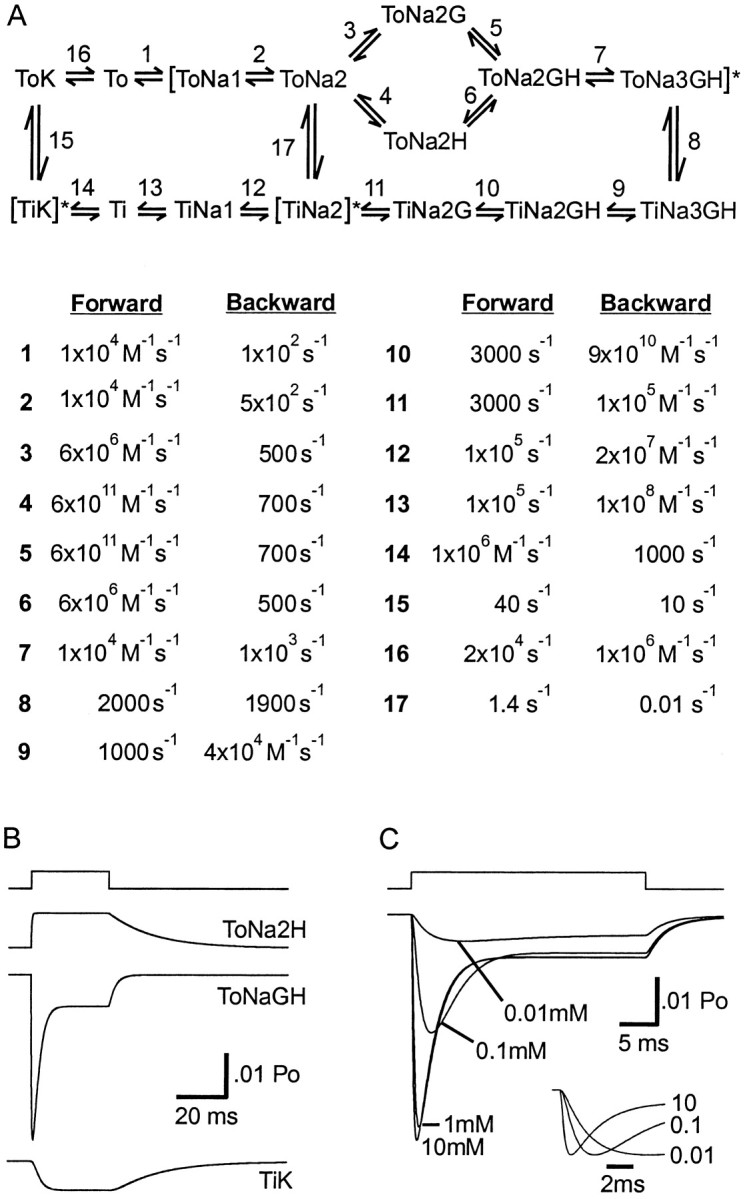
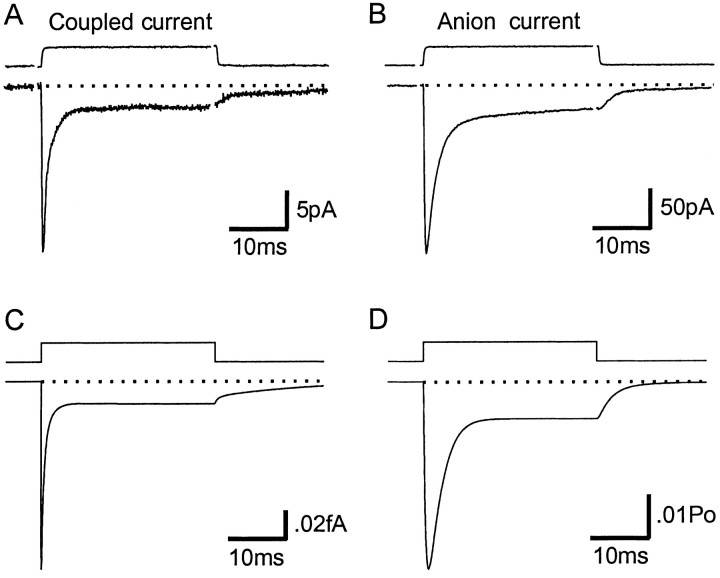
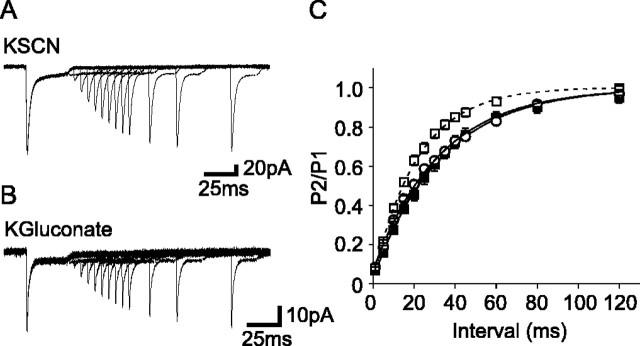
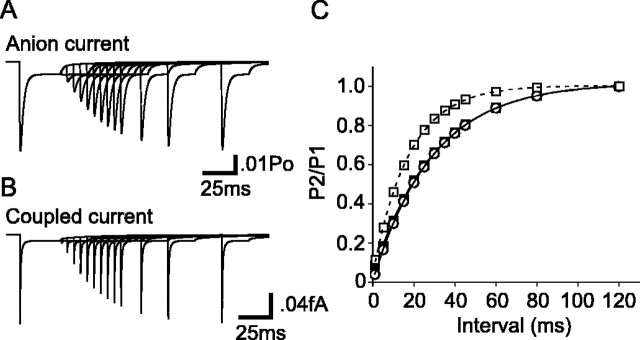
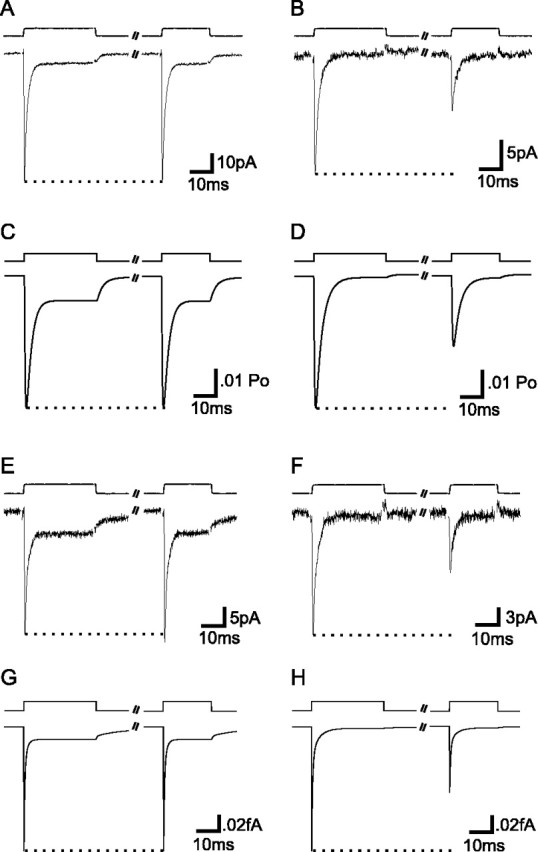
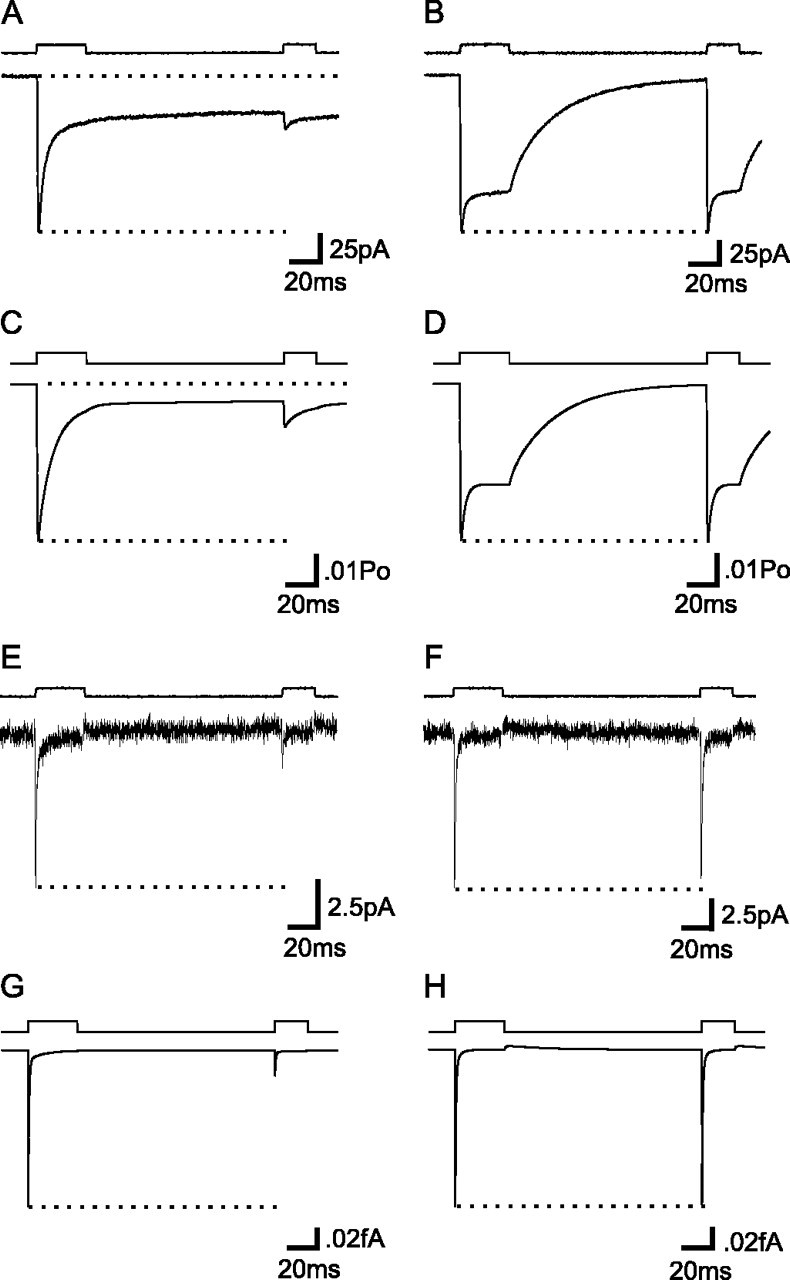
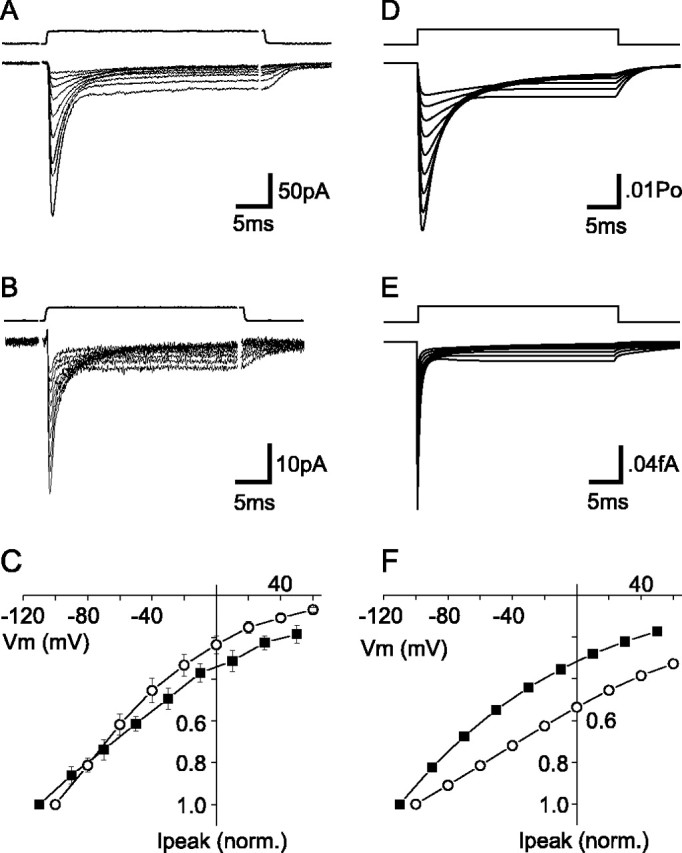
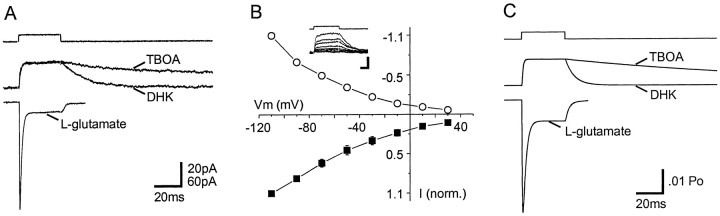
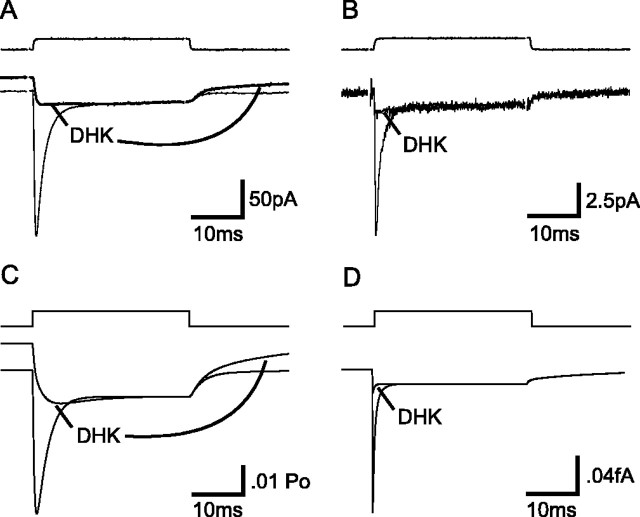
The transport of glutamate across the plasma membrane is coupled to the movement of cations (Na+, K+, and H+) that are necessary for glutamate uptake and transporter cycling as well as anions that are uncoupled from the flux of glutamate. Although the relationship between these coupled (stoichiometric) and uncoupled (anion) transporter currents is poorly understood, transporter-associated anion currents often are used to monitor transporter activity. To define the kinetic relationship between these two components, we have recorded transporter currents associated with stoichiometric and anion charge movements occurring in response to the rapid application of l-glutamate to outside-out patches from human embryonic kidney cells expressing GLT-1 transporters. Transporter-associated anion currents were approximately twice as slow to rise and decay as stoichiometric transport currents, but the presence of permeant anions did not slow transporter cycling. A kinetic model for GLT-1 was developed to simulate the behavior of both components of the transporter current and to estimate the capture efficiency of GLT-1. In this model the K+ counter-transport step was defined as rate-limiting, consistent with the slowing of transporter cycling after the substitution of internal K+ with Cs+ or Na+. The model predicts that in physiological conditions approximately 35% of GLT-1 transporters function as buffers, releasing glutamate back into the extracellular space after binding.


Figures

Fig. 1.
Fig. 1.
Characteristics of GLT-1 transporter currents in outside-out patches. A, Response of an outside-out patch removed from a HEK cell expressing GLT-1 to a range ofl-glutamate concentrations. Inset, The peak responses to 0.01 and 0.1 mml-glutamate have been scaled to the peak of the response to 10 mml-glutamate to illustrate the concentration dependence of the rise time of the transporter currents. B,l-Glutamate dose–response relationship of the peak (open circles) and the steady-state (filled circles) amplitudes of GLT-1-mediated transporter currents. Data were fit with the logistic equation; KSCN-based internal solution.
Fig. 2.
Fig. 2.
Kinetic model of the GLT-1 transporter.A, Illustration of the discrete states and transition rates present in the model. Four transitions are voltage-dependent: ToNa2GH to ToNa3GH (zδ = 0.55), TiNa3GH to TiNa2GH (zδ = 0.4, asymmetry of 0.1), TiK to ToK (zδ = 0.59, asymmetry of 0.9), and Toto ToNa1 (zδ = 0.46). Anion conducting states (data not shown) are attached to the following states: ToNa1, ToNa2, ToNa2G, ToNa2H, ToNa2GH (all with opening rates of 50/sec and closing rates of 4700/sec), ToNa3GH (opening rate, 1500/sec; closing rate, 10,000/sec), TiNa2 (opening rate, 80/sec; closing rate, 4700/sec), and TiK (opening rate, 55/sec; closing rate, 4700/sec). Simulated anion conductances are the sum of all of these states. The numbers in the columns correspond to the rates for the transitions noted in the model.B, Occupancies of the three states that are the main contributors to the anion conductance in control conditions in response to a 30 msec application of 10 mml-glutamate. A downward deflection indicates increased occupancy of the state.C, Simulated dose–response of the anion conductance for 0.01–10 mml-glutamate (sum of all anion conducting states). Inset, Simulated peak responses to 0.01 and 0.1 mm glutamate have been scaled to the peak response of 10 mm glutamate.
Fig. 3.
Fig. 3.
Comparison of coupled and uncoupled responses elicited by l-glutamate. A,l-Glutamate-evoked (10 mm) transporter current from an outside-out patch recorded in the absence of permeant anions (K-gluconate-based internal solution). B,l-Glutamate-evoked (10 mm) transporter current from an outside-out patch recorded in the presence of permeant anions (KSCN-based internal solution). C, Simulation of the GLT-1 model in response to 10 mml-glutamate in the absence of permeant anions (plot of charge transfer vs time for a single transporter). D, Simulation result of the GLT-1 model in response to 10 mml-glutamate in the presence of permeant anions.
Fig. 4.
Fig. 4.
The paired pulse recovery rate of GLT-1 transporters is not affected by the presence of permeant anions.A, Response of a patch to pairs of applications of 10 mml-glutamate (KSCN-based internal solution). The interval between control (30 msec duration) and test (20 msec duration) applications was 1–120 msec. B, Response of a patch to paired applications of 10 mml-glutamate recorded without permeant anions in the internal solution (K-gluconate-based internal solution).C, Plot of the ratio of the peak amplitude of the second (P2) to the first (P1) response to paired applications of 10 mml-glutamate recorded with (filled squares) and without anions (open circles) in the internal solution (solid linesare single exponential fits to the data). Removal of TEA-Cl (10 mm) from the internal solution (open squares) speeded the decay by ∼35% (dashed line).
Fig. 5.
Fig. 5.
Simulations of the paired pulse recovery rate of GLT-1 transporters. A, Simulated uncoupled (anion conductance) responses of a patch to paired applications of 10 mml-glutamate. The protocol is the same as in Figure 4. B, Simulated coupled responses of a patch to paired applications of 10 mml-glutamate.C, Plot of the ratio of the peak amplitude of the second (P2) to the first (P1) response to paired applications of 10 mml-glutamate recorded with (filled squares) and without anions (open circles) in the internal solution (solid linesare single exponential fits to the data). The dashed line is a single exponential fit to the model adjusted to reflect the removal of TEA-Cl (open squares; see Results).
Fig. 6.
Fig. 6.
Internal Cs+ slows the cycling rate of GLT-1 transporters. A, Response of a patch to paired applications of l-glutamate (10 mm) (interval, 120 msec); KNO3-based internal solution.B, Response of a patch to the paired application ofl-glutamate (10 mm) as in A but recorded with a CsNO3-based internal solution.C, Simulation of uncoupled conductance (anion current) as in A. D, Simulation of uncoupled conductance to reflect slower binding of Cs+ as inB. E, Response of a patch to paired applications of l-glutamate (10 mm) separated by 120 msec recorded with a K-gluconate-based internal solution.F, Response of a patch to paired applications ofl-glutamate (10 mm) separated by 120 msec recorded with a Cs-gluconate-based internal solution. G, Simulations of the coupled current in E.H, Simulations of the coupled current adjusted to reflect the slower binding of Cs+ as inF.
Fig. 7.
Fig. 7.
Replacement of internal K+ with Na+ inhibits transporter cycling. A, Response of a patch to the paired application ofl-glutamate (10 mm) separated by 120 msec, recorded with a NaSCN-based internal solution. B, Response of a different patch to the paired application ofl-glutamate (10 mm) recorded with a NaSCN-based internal solution containing 10 mml-glutamate.C, Simulation of the response to the paired application of l-glutamate (10 mm) separated by 120 msec with a NaSCN-based internal solution. D, Simulation response to the paired application of l-glutamate (10 mm) separated by 120 msec with a NaSCN-based internal solution containing 10 mml-glutamate.E, Response of a patch to the paired application ofl-glutamate (10 mm) recorded without permeant anions in the internal solution (Na-gluconate-based internal solution).F, Response of a patch to the paired application ofl-glutamate (10 mm) recorded with a Na-gluconate-based internal containing 10 mml-glutamate. G, Same as C but without internal permeant anions (Na-gluconate-based internal solution). H, Same as D but without permeant anions (Na-gluconate-based internal solution and 10 mml-glutamate).
Fig. 8.
Fig. 8.
Voltage dependence of coupled and uncoupled GLT-1-mediated transporter currents. A, Response of a patch to 10 mml-glutamate recorded at membrane potentials between −100 and −60 mV (KSCN-based internal solution).B, Response of a patch to 10 mml-glutamate recorded at membrane potentials between −110 and −50 mV (K-gluconate-based internal solution). C, Plot of the current to voltage (I–V) relationship for the peak amplitude recorded in response to 10 mml-glutamate in the presence (KSCN,opencircles) or absence (K-gluconate,filled squares) of permeant anions.D, Simulation of uncoupled conductance to 10 mml-glutamate recorded at membrane potentials between −100 and −60 mV. E, Simulation of coupled current to 10 mml-glutamate recorded at membrane potentials between −110 and −50 mV. F, Simulated current to voltage (I–V) relationships for the peak amplitude simulated responses in D(uncoupled conductance, filled circles) andE (coupled current, filled squares).
Fig. 9.
Fig. 9.
Block of anion leak current by nontransported GLT-1 antagonists. A, The application of dihydrokainate (DHK; 300 μm) ord,l-threo-β-benzyloxyaspartate (TBOA; 300 μm) elicited outward shifts in the holding current in patches recorded with permeant anions in the internal solution (KSCN-based internal solution). The response to the same patch to 10 mml-glutamate is shown by thebottom trace. The values for the vertical scale bar are 20 pA (top traces) and 60 pA (bottom trace). B, Voltage dependence of the peak amplitudes of responses to either 300 μm DHK (filled circles; error bars withinsymbols) or 10 mml-glutamate (filled squares).Inset, responses to DHK at potentials between −100 and 60 mV. Calibration: 10 msec, 20 pA. C, Simulations of responses to DHK (binding rate, 3 × 10⁶ perm/sec; unbinding rate, 165/sec) and to TBOA (binding rate, 3 × 10⁶ per m/sec; unbinding rate, 6/sec).
Fig. 10.
Fig. 10.
Kinetics of inhibition of GLT-1 transporters by DHK. A, Response of a patch to either 10 mml-glutamate alone (bottomtrace, thin line) or 10 mml-glutamate plus 300 μm DHK (top trace, thick line); for the latter response the patches were stepped from a solution with 300 μm DHK to one containing 10 mml-glutamate plus 300 μm DHK.B, Responses recorded in the absence of permeant anions in the internal solution (K-gluconate internal solution) as inA. C, Simulations of uncoupled conductance illustrating the effect of DHK (300 μm) on the response of GLT-1 to 10 mml-glutamate.D, Simulations of coupled current illustrating the effect of DHK.

References

    1. Arriza JL, Fairman WA, Wadiche JI, Murdoch GH, Kavanaugh MP, Amara SG. Functional comparisons of three glutamate transporter subtypes cloned from human motor cortex. J Neurosci. 1994;14:5559–5569. - PMC - PubMed
    1. Auger C, Attwell D. Fast removal of synaptic glutamate by postsynaptic transporters. Neuron. 2000;28:547–558. - PubMed
    1. Barbour B. An evaluation of synapse independence. J Neurosci. 2001;21:7969–7984. - PMC - PubMed
    1. Barbour B, Attwell D. Electrogenic uptake of glutamate and aspartate into glial cells isolated from the salamander (Ambystoma) retina. J Physiol (Lond) 1991;436:169–193. - PMC - PubMed
    1. Bergles DE, Jahr CE. Synaptic activation of glutamate transporters in hippocampal astrocytes. Neuron. 1997;19:1297–1308. - PubMed

Publication types

MeSH terms

LinkOut - more resources