. 2002 Dec 1;22(23):10251-66.
doi: 10.1523/JNEUROSCI.22-23-10251.2002.

Number, density, and surface/cytoplasmic distribution of GABA transporters at presynaptic structures of knock-in mice carrying GABA transporter subtype 1-green fluorescent protein fusions

Affiliations

Number, density, and surface/cytoplasmic distribution of GABA transporters at presynaptic structures of knock-in mice carrying GABA transporter subtype 1-green fluorescent protein fusions

Chi-Sung Chiu et al. J Neurosci. .

Abstract

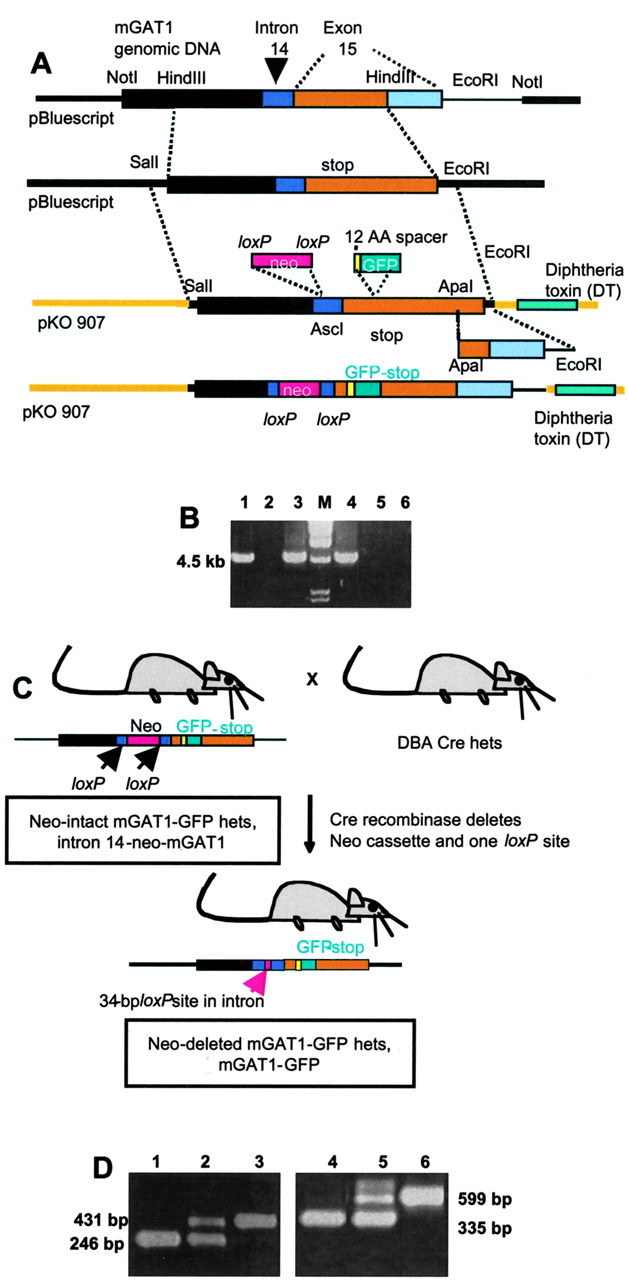
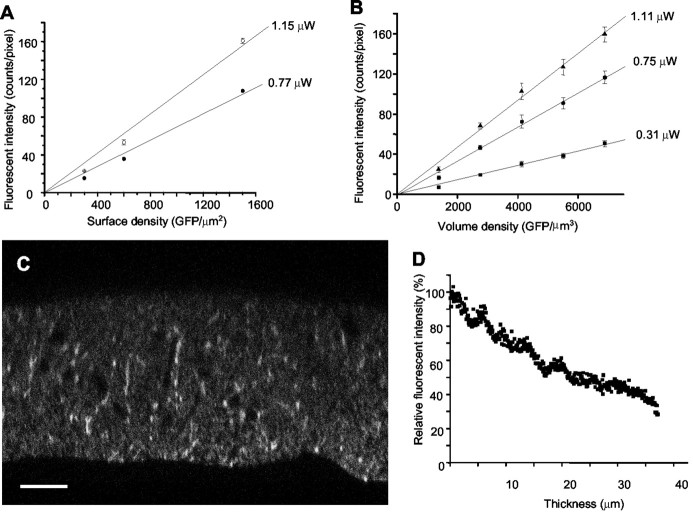
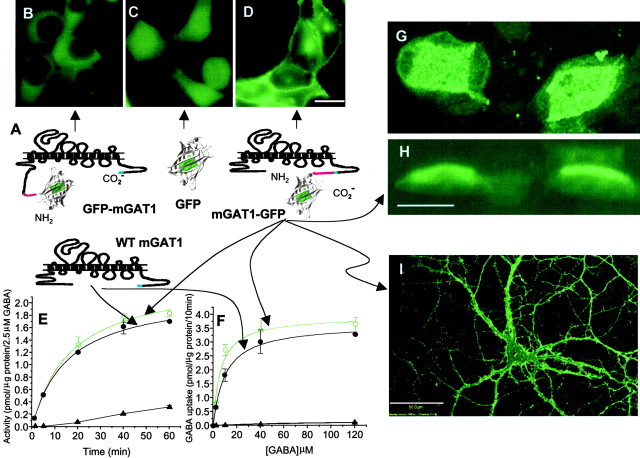
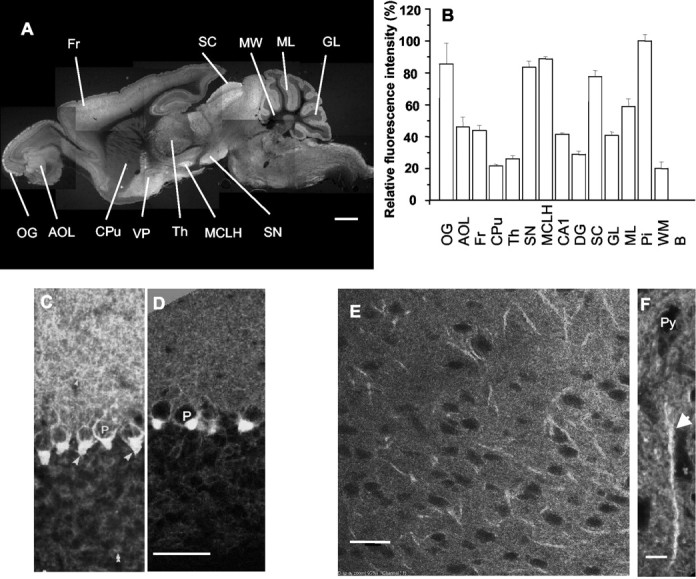
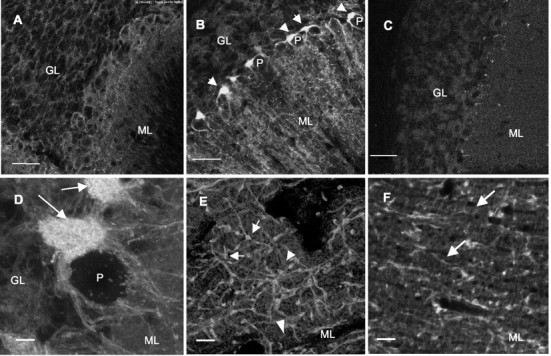
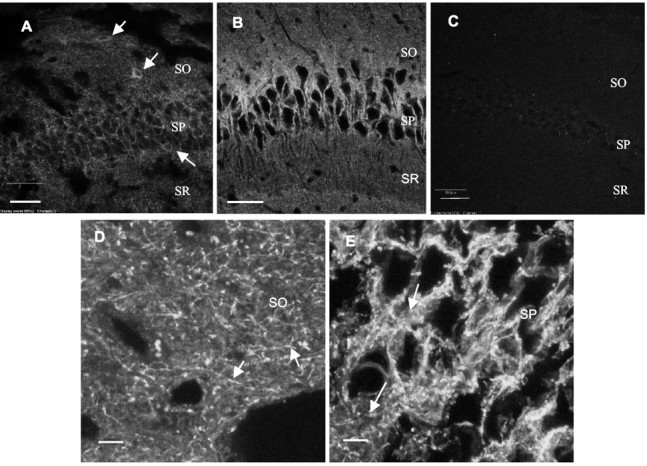
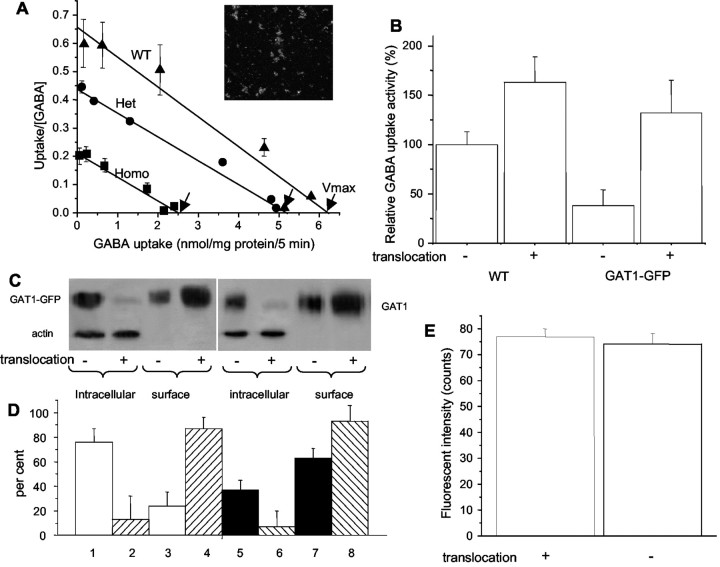
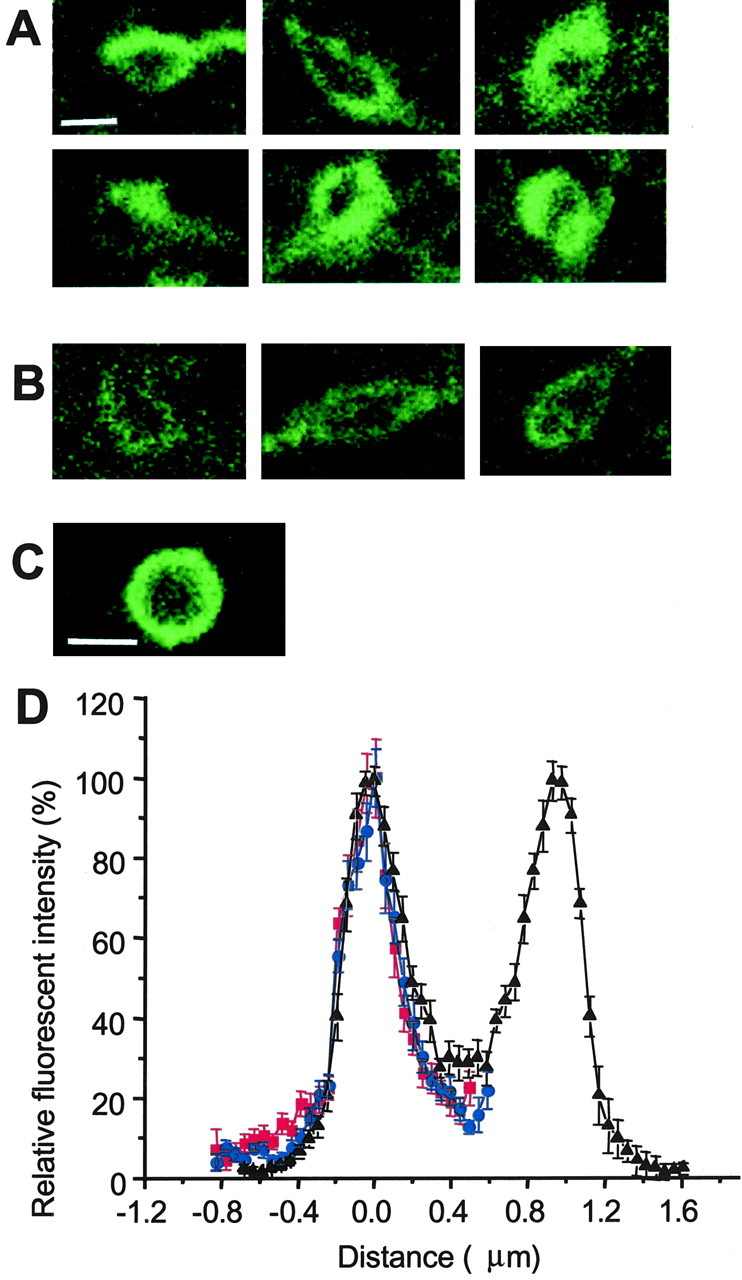
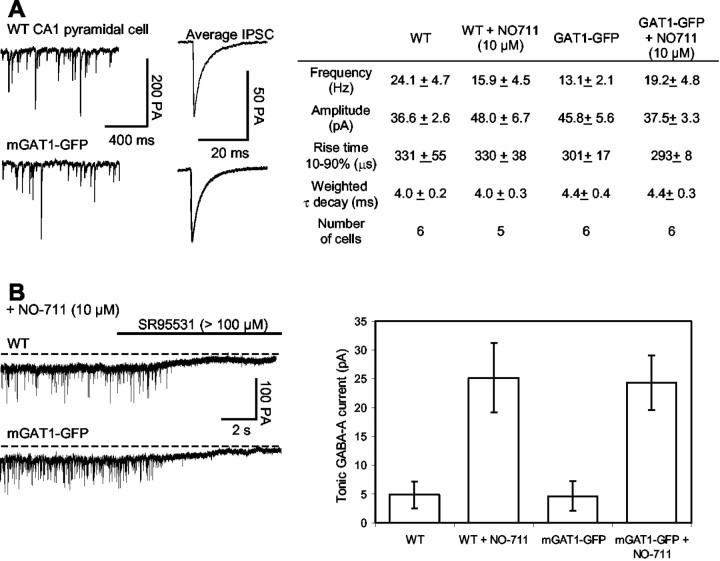
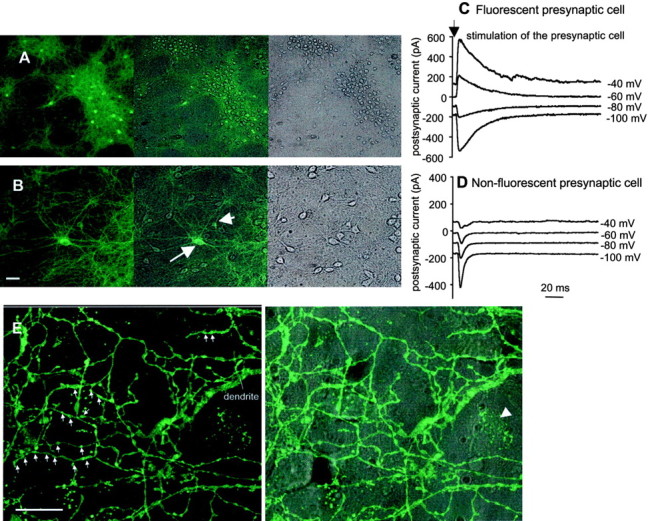
GABA transporter subtype 1 (GAT1) molecules were counted near GABAergic synapses, to a resolution of approximately 0.5 microm. Fusions between GAT1 and green fluorescent protein (GFP) were tested in heterologous expression systems, and a construct was selected that shows function, expression level, and trafficking similar to that of wild-type (WT) GAT1. A strain of knock-in mice was constructed that expresses this mGAT1-GFP fusion in place of the WT GAT1 gene. The pattern of fluorescence in brain slices agreed with previous immunocytochemical observations. [3H]GABA uptake, synaptic electrophysiology, and subcellular localization of the mGAT1-GFP construct were also compared with WT mice. Quantitative fluorescence microscopy was used to measure the density of mGAT1-GFP at presynaptic structures in CNS preparations from the knock-in mice. Fluorescence measurements were calibrated with transparent beads and gels that have known GFP densities. Surface biotinylation defined the fraction of transporters on the surface versus those in the nearby cytoplasm. The data show that the presynaptic boutons of GABAergic interneurons in cerebellum and hippocampus have a membrane density of 800-1300 GAT1 molecules per square micrometer, and the axons that connect boutons have a linear density of 640 GAT1 molecules per micrometer. A cerebellar basket cell bouton, a pinceau surrounding a Purkinje cell axon, and a cortical chandelier cell cartridge carry 9000, 7.8 million, and 430,000 GAT1 molecules, respectively; 61-63% of these molecules are on the surface membrane. In cultures from hippocampus, the set of fluorescent cells equals the set of GABAergic interneurons. Knock-in mice carrying GFP fusions of membrane proteins provide quantitative data required for understanding the details of synaptic transmission in living neurons.


Figures

Fig. 1.
Fig. 1.
Generation and screening of knock-in strains.A, Modification of mGAT1 genomic DNA to generate a targeting plasmid that contains an mGAT1–GFP fusion sequence in an exon and a floxed neomycin selection cassette in an intron. See Materials and Methods for details. B, PCR screening to identify ES cells carrying the mutant gene. A 4.5 kb PCR product is expected. Lanes 1, 3, and4 represent positive ES cell clones; lane 2 is a negative clone. Lanes 5 and6 show negative controls with no PCR products from genomic DNA extracted from WT ES cells and from the final pKO plasmid construct shown in A. Lane M shows molecular length standards. C, Generation of the Neo-deleted mGAT1–GFP knock-in mouse. The intron 14-Neo-mGAT1 heterozygotes were mated with DBA mice carrying cre recombinase to eliminate the neomycin selection cassette. D, Exemplar PCR genotyping results. Lanes 1–3 show PCR products for mice that are homozygous for the presence of the GFP fusion, heterozygous, and WT, respectively. Lanes 4–6 represent the screening for mice that are homozygous for the presence of the Neo cassette, heterozygous, and WT, respectively.
Fig. 2.
Fig. 2.
GFP characterization in beads, gels, and tissue samples. A, B, Calibration lines generated for His6–GFP beads (A) and His6–GFP in polyacrylamide gels (B) using the Leica confocal system. The measured slopes for His6–GFP beads are 0.10379 and 0.06944 (counts per pixel per GFP per square micrometer) at 1.15 and 0.77 μW, respectively. The measured slopes for His6–GFP in polyacrylamide gels were 0.02343, 0.01683, and 0.00718 (intensity per pixel per GFP per cubic micrometer) illuminated with 1.11, 0.75, and 0.31 μW, respectively.C, xz projection of a slice from the cerebellar ML region. Scale bar, 10 μm.D, The profile of the decreased fluorescent intensity along the z-axis, averaged along thex-axis from C.
Fig. 3.
Fig. 3.
Testing and selecting the mGAT1–GFP fusion.A, The four constructs, mGAT1–GFP, mGAT1, and GFP in pcDNA3.1(+), and GFP–mGAT1 in pGFP37 were made to test the function of mGAT1–GFP fusions. The spacer sequences (8 residues for GFP–mGAT1, 12 residues for mGAT1–GFP) are shown in red. The C-terminal AYI sequence is shown in blue. B, The GFP–mGAT1 fusion is expressed mostly in the cytoplasm but not the nucleus of HEK cells and shows only slight increases in GABA uptake (data not shown). C, GFP expresses in cytoplasm and in the nucleus. D, The mGAT1–GFP fusion protein expresses on the membrane of HEK cells as well as in the cytoplasm, a typical situation for overexpressed proteins. E,F, Kinetics of GABA uptake by these fusion proteins expressed in HEK cells, tested at 2.5 μm GABA for time dependence (E) and in a 10 min assay for concentration dependence (F). mGAT1–GFP GABA uptake activity (○, green line) was indistinguishable from that of WT mGAT1 (●, black line). On the other hand, HEK cells expressing GFP (▴) have GABA uptake activity indistinguishable from noninfected cells. The GFP–mGAT1 fusion showed only slight increases in GABA uptake compared with untransfected cells (data not shown). G, H, Fluorescence on the apical membrane of MDCK cells transfected with a recombinant mGAT1–GFP lentivirus. The face-on view of an image stack (G) and the side view of the same stack (H) are illustrated. I, mGAT1 expressed in a cultured E18 hippocampal cell, infected after 12 d in culture with the recombinant lentivirus and imaged 5 d later. All labeled processes derive from one cell. Scale bars:B–D, 25 μm; G, H, 20 μm; I, 50 μm.
Fig. 4.
Fig. 4.
Overview of fluorescence in mGAT1–GFP mice.A, Montage forming a sagittal section ∼1.2 mm from the midline; homozygote. B, Relative mGAT1–GFP fluorescence intensity in various regions. C, D, Cerebellar cortex; comparison of previously published immunohistochemistry (C) (Radian et al., 1990), transformed to produce a negative image, with mGAT1–GFP expression (D); heterozygote, single confocal image from a 35 μm slice. E, F, Frontal cortex, layer 5/6. The linear objects are chandelier cell cartridges (F, arrow) surrounding the initial segments of pyramidal cells. E, Single confocal section from a heterozygote; F, projected stack (5 μm thick) from confocal sections of a homozygote. OG, Glomeruli of olfactory bulb; AOL, anterior olfactory nucleus;Fr, frontal cortex; Cpu, caudate putamen;Th, thalamus; SN, substantia nigra;MCLH, magnocellular nucleus of lateral hypothalamus;CA1, field of Ammon's horn in hippocampus;DG, dentate gyrus; SC, superior colliculus; GL, cerebellar granule layer;ML, cerebellar molecule layer; Pi, pinceaux; Py, pyramidal cell; WM, cerebellar white matter; EPI, external plexiform layer in olfactory bulb; VP, ventral pallidum. Scale bars:A, 1 mm; CE, 50 μm;F, 10 μm.
Fig. 5.
Fig. 5.
Details of mGAT1–GFP fluorescence in cerebellum, including individual boutons. A, In a P9 mGAT1–GFP mouse, mGAT1–GFP expresses in somata of several cell types; however, no obvious axonal expression was observed. B, In a P29 mGAT1–GFP mouse, mGAT1–GFP is clearly expressed in axons and boutons in the molecular layer (ML) and in pinceaux (arrows) surrounding the axonal hillock of Purkinje cells (P). The background stripe-like structures in ML are probably Bergmann glia.C, The P29 WT shows low background fluorescence and no obvious structures. This image was taken under >10-fold higher illumination photopower and has been further brightened digitally more than the other images. D, mGAT1–GFP expresses in pinceaux (arrows) in the hillock of a Purkinje cell (P). E, mGAT1–GFP fluorescence in axons and boutons in ML. Boutons with higher (arrows) and lower (arrowheads) levels of mGAT1–GFP are indicated. F, The diffuse stripe-like structures (arrows) represent the putative Bergmann glia expressing mGAT1–GFP. This structure is most evident in horizontal sections, probably revealing the glial palisades of Altman (Altman and Bayer, 1997). ML, Molecule layer;GL, granule cell layer; P, Purkinje. Scale bars: AC, 50 μm;DF, 5 μm. A,B, Single confocal slices from heterozygotes;DF, projected stacks (6, 4, and 4 μm thick, respectively) from homozygotes.
Fig. 6.
Fig. 6.
Details of mGAT1–GFP fluorescence in CA1 region of hippocampus. A, In a heterozygous P9 mGAT1–GFP mouse, fluorescence is observed both in somata of inhibitory interneurons (arrows) and at synapses near and in the pyramidal cell layer. B, In a 3 month postnatal homozygous mouse, fluorescence is observed only in axons and synapses but not in somata. C, A P29 WT mouse shows low background fluorescence and no obvious structures. This image was taken at >10-fold higher illumination photopower and has been further brightened digitally more than the other images. D, High-magnification view of stratum oriens, showing fluorescent axons (arrows) and boutons. The dimmer background fluorescence could be caused by expression in astrocytes. Brain tissues were prepared from homozygote, 60 d postnatal mouse. E, Neuropil (arrows) in pyramidal cell layers. The lack of clear axon and bouton images could be attributable to mGAT1–GFP expression in both astrocytes and axons (Yan et al., 1997). Brain tissues were prepared from homozygote, 60 d postnatal mouse.SO, Stratum oriens; SP, stratum pyramidale; SR, stratum radiatum. A,D, E, Projected stacks (5, 4, and 4 μm thick, respectively). Scale bars: B, 50 μm;C, 40 μm; A, D,E, 5 μm.
Fig. 7.
Fig. 7.
GABA uptake and biotinylation assays for mGAT1–GFP partitioning. A, Scatchard plot of [3H]GABA uptake for all three mGAT1–GFP genotypes (mean ± SEM; n = 3). Insetshows image of green fluorescent synaptosomes. B, Manipulation of membrane/cytoplasmic partitioning, assayed by [3H]GABA uptake. Data show NO-711-sensitive [3H]GABA uptake, measured over a time course of 1 hr at 4°C. Synaptosomes were preincubated for 10 min with control solution or subjected to “translocation treatment” with orthovanadate (50 μm), bisindolylmaleimide II (100 nm) to inactivate PKC, and 0.45 m sucrose, all at 4°C. C, Manipulation of membrane/cytoplasmic partitioning, assayed by surface biotinylation of cerebellar slices.Lanes 1–4, Tissue from mGAT1–GFP mice, probed with anti-GFP antibody. Lanes 5–8, Tissue from WT mice, probed with anti-GAT1 antibody. Lanes 1,2, 5, and 6 were also probed with anti-actin antibody. D, Quantitation of immunostaining for mGAT1–GFP and mGAT1 in lanes 1–8.y-axis shows percentage of total staining (intracellular + extracellular) in the pair of lanes denoted by similar patterns.Lane pairs 1 + 3, 2 +4, 5 + 7, and6 + 8 add up to 100%. Data are mean ± SEM from three experiments like that of C.E, Fluorescence intensity in single boutons, untreated or subjected to translocation treatment.
Fig. 8.
Fig. 8.
Single-bouton images and point-spread function (A, B). Projections are of confocal stacks in cerebellar ML, 1–1.5 μm thick. Scale bar, 1 μm.A, Boutons with higher total mGAT1–GFP expression show subregions of higher fluorescence. B, Boutons with lower fluorescence levels show more evenly distributed fluorescence.C, Single confocal image of an individual latex bead coated with His6–GFP. Scale bar, 1 μm. D, Profiles of GFP fluorescence in single confocal images of the beads (black), boutons from slices subjected to translocation treatment (red), and boutons from untreated slices (blue). Mean ± SEM; n = 16 each.
Fig. 9.
Fig. 9.
Electrophysiology of GABAergic transmission to CA1 pyramidal neurons in hippocampal slices from WT and mGAT1–GFP mice. A, Spontaneous GABAA-mediated IPSCs in Cl-loaded CA1 pyramidal cells (holding potential, −70 mV). Averages of 50 IPSCs from WT and mGAT–GFP slices are shown. Right-hand panelshows mean ± SEM of several parameters. B, Tonic GABAA receptor-mediated currents recorded in Cl-loaded CA1 pyramidal cells (holding potential, −70 mV). In the presence of NO-711 (10 μm), application of the GABAA receptor antagonist SR-95531 (>100 μm) blocked the spontaneous IPSCs and caused an outward shift in the baseline by 30–40 pA. This change represents the tonic GABAA receptor-mediated current and was observed in cells from both WT and mGAT1 mice. The right-hand panelshows mean ± SEM of the tonic current in WT and mGFP slices, in the presence and absence of NO-711.
Fig. 10.
Fig. 10.
Electrophysiological measurements show that inhibitory interneurons fluoresce in hippocampal dissociated culture.A, B, Cultured hippocampal neurons were imaged with 10× (A) and 20× (B) objectives. The images show the fluorescent neurons under epifluorescence (left) and all neurons under transmitted light (right). The merged images are shown in the center panels. There are 16–18 fluorescent neurons in A and 5 (of which the 2 most obvious are marked with arrows) in B. Scale bars:A, 100 μm; B, 50 μm.C, D, Exemplar waveforms of voltage–clamp currents recorded from nonfluorescent postsynaptic cells studied at various holding potentials. C, Records during stimulation of a fluorescent presynaptic cell. D, Another cell; records during stimulation of a nonfluorescent presynaptic cell. E, The axon of a dissociated hippocampal interneuron forms synaptic boutons on nearby excitatory neurons. Scale bar, 20 μm. Left panel, Fluorescence only; arrows point to boutons that make contact on a nonfluorescent soma. Right panel, Fluorescence overlaid on Nomarski image of the culture. In the right-hand panel, the pointer identifies a glial cell expressing GAT1 (arrowhead).

Similar articles

Cited by

References

    1. Acsady L, Gorcs TJ, Freund TF. Different populations of vasoactive intestinal polypeptide-immunoreactive interneurons are specialized to control pyramidal cells or interneurons in the hippocampus. Neuroscience. 1996;73:317–334. - PubMed
    1. Ahn J, Mundigl O, Muth TR, Rudnick G, Caplan MJ. Polarized expression of GABA transporters in Madin-Darby canine kidney cells and cultured hippocampal neurons. J Biol Chem. 1996;271:6917–6924. - PubMed
    1. Altman J, Bayer S . . Development of the cerebellar system in relation to its evolution, structure, and functions. CRC; Boca Raton, FL: 1997.
    1. Anglister L, Stiles JR, Salpeter MM. Acetylcholinesterase density and turnover number at frog neuromuscular junctions, with modeling of their role in synaptic function. Neuron. 1994;12:783–794. - PubMed
    1. Barakat L, Bordey A. GAT-1 and reversible GABA transporter in Bergmann glia in slices. J Neurophysiol. 2002;88:1407–1419. - PubMed

Publication types

MeSH terms

LinkOut - more resources