. 2002 Dec 1;22(23):10267-76.
doi: 10.1523/JNEUROSCI.22-23-10267.2002.

Quantal size and variation determined by vesicle size in normal and mutant Drosophila glutamatergic synapses

Affiliations

Quantal size and variation determined by vesicle size in normal and mutant Drosophila glutamatergic synapses

Shanker Karunanithi et al. J Neurosci. .

Abstract

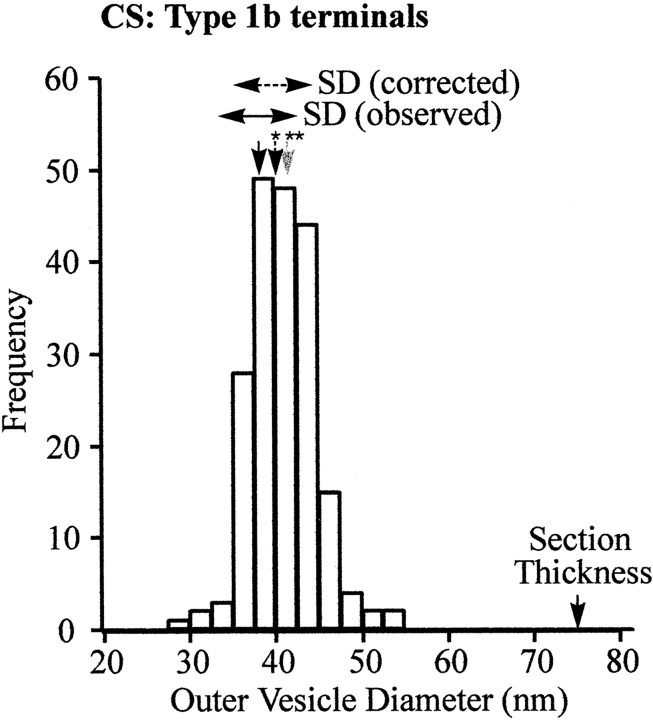
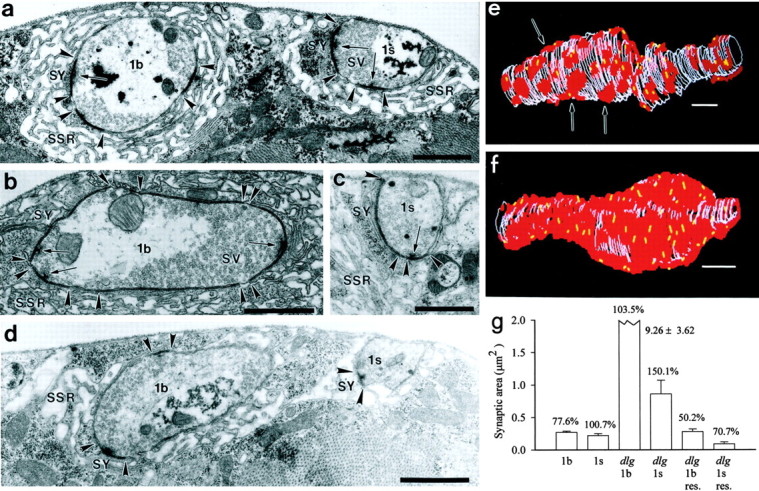
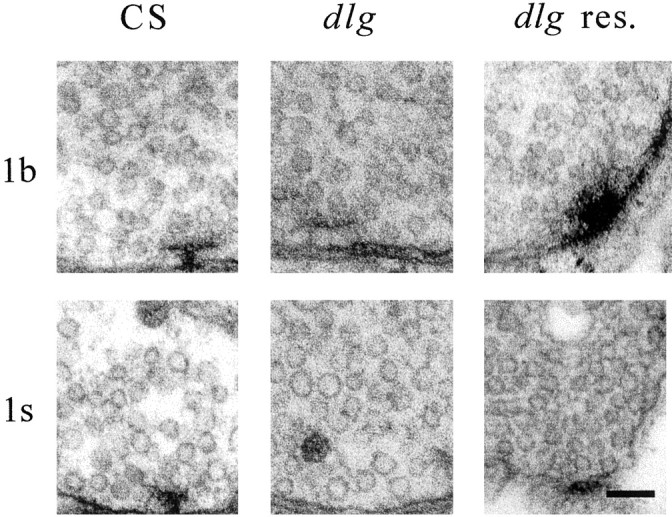
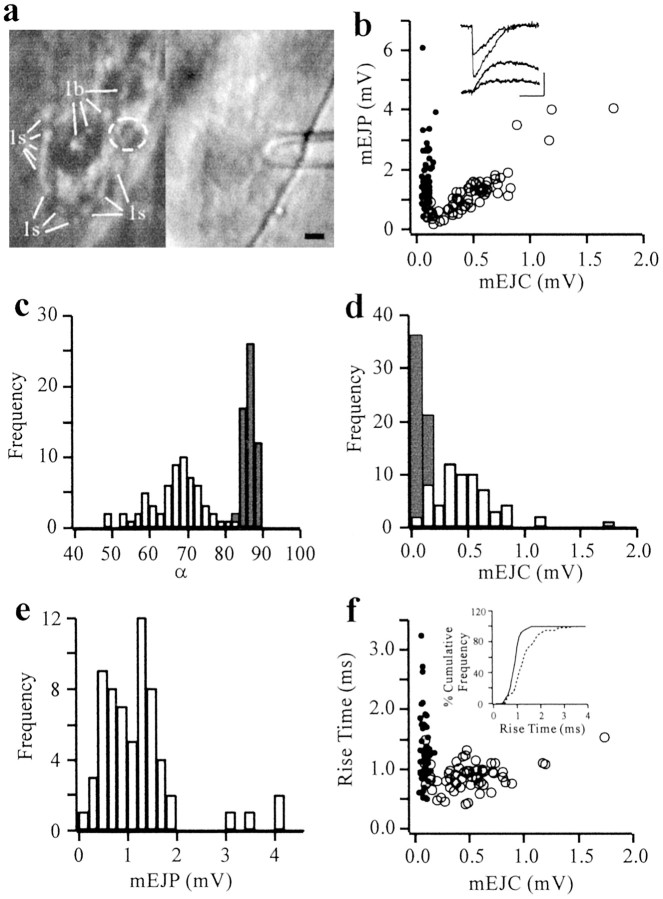
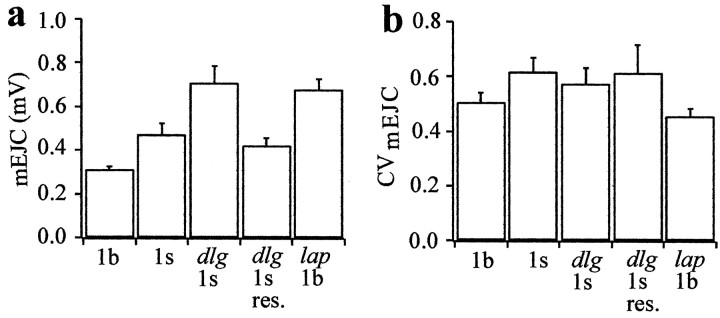
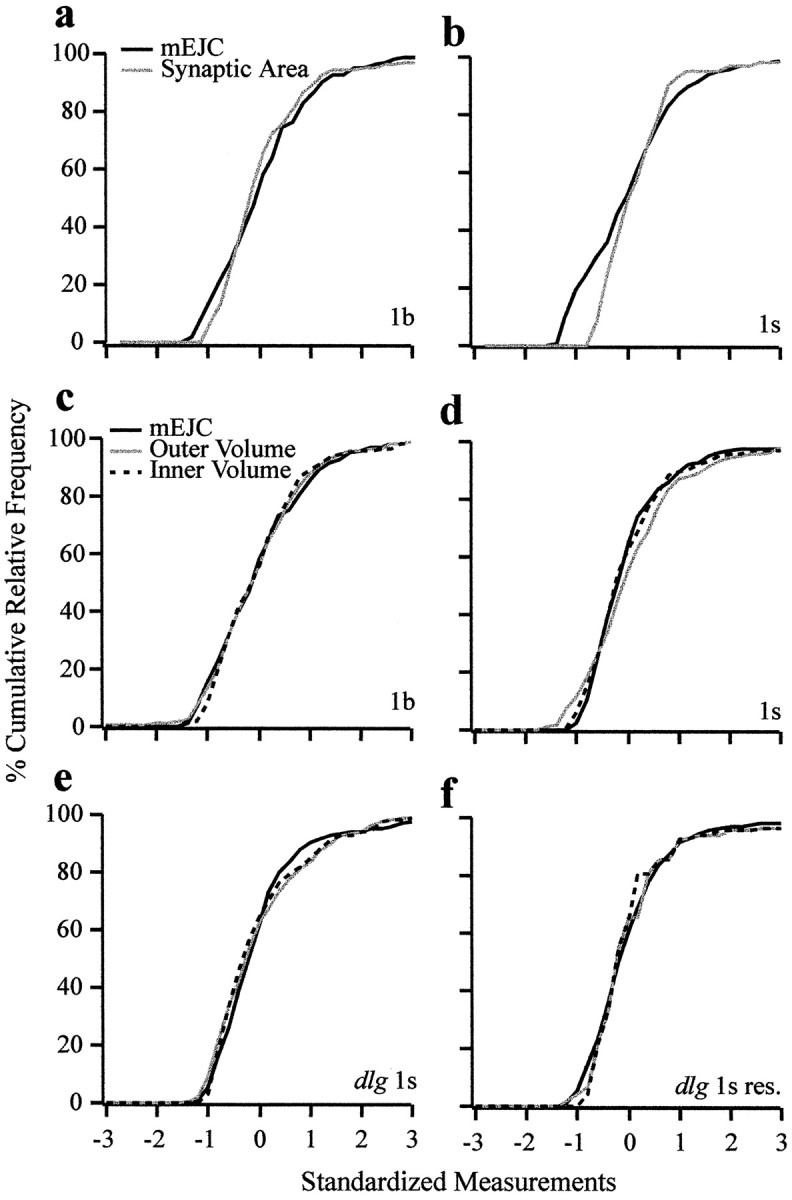
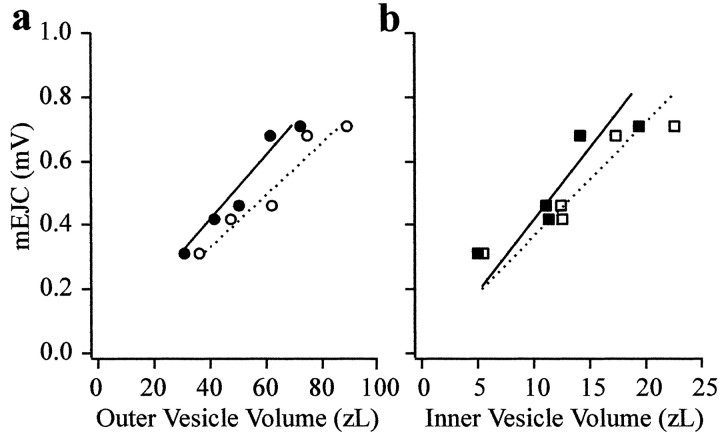
Quantal size and variation at chemical synapses could be determined presynaptically by the amount of neurotransmitter released from synaptic vesicles or postsynaptically by the number of receptors available for activation. We investigated these possibilities at Drosophila glutamatergic neuromuscular synapses formed by two separate motor neurons innervating the same muscle cell. At wild-type synapses of the two neurons we found a difference in quantal size corresponding to a difference in mean synaptic vesicle volume. The same finding applied to two mutants (dlg and lap) in which synaptic vesicle size was altered. Quantal variances at wild-type and mutant synapses were similar and could be accounted for by variation in vesicular volume. The linear relationship between quantal size and vesicular volume for several different genotypes indicates that glutamate is regulated homeostatically to the same intravesicular concentration in all cases. Thus functional differences in synaptic strength among glutamatergic neurons of Drosophila result in part from intrinsic differences in vesicle size.


Figures

Fig. 1.
Fig. 1.
Synaptic vesicle measurements for CS type 1b boutons, illustrating the form of the distribution and the effect on the estimated mean diameter of applying two corrections: that ofFroesch (1973)* and that of Parsons et al. (1995)**. For all samples the latter correction produced a larger displacement of the mean value. Note that a substantial fraction of the values appears to the right side of the median, indicating nonuniformity in synaptic vesicle size. Observed and corrected (Froesch, 1973) SDs also are indicated by thehorizontal lines; the correction has a small effect on this value.
Fig. 2.
Fig. 2.
Ultrastructure of synapses at CS,dlgm52 mutant, and rescueddlg neuromuscular junctions. a, Neuromuscular synapses formed by 1b and 1s boutons in CS larva.b, c, Synapses in adlgm52 mutant larva (b, 1b; c, 1s). d, Synapses of 1b and 1s boutons in a mutant rescued larva (dlg res.). Synapses (SY) are delimited by arrowheads; presynaptic dense bodies (active zone structures) are delimited by indicated arrows. Each synapse occurs in association with subsynaptic reticulum (SSR); synaptic vesicles (SV) are plentiful in all terminals. Note that densely stained synaptic membranes are much more extensive and synaptic vesicles are larger in dlgm52 mutant boutons than in control (CS and dlg res.) counterparts. Scale bar: (in d) a–d, 1.0 μm.e, f, Serial reconstructions of type 1b boutons from CS (e) and dlg(f) larvae to illustrate a major difference in synaptic structure. Boutons of dlg larvae have larger synaptic areas than controls (red regions); synapses are often confluent. The dense bars are shown in yellow. Scale bars, 1 μm. g, Histogram of the size of synaptic areas in CS (1b, 129 synapses, 15 boutons; 1s, 61 synapses, 15 boutons), dlgm52 (1b, 3 synapses, 3 boutons; 1s, 37 synapses, 10 boutons), and dlg res. (1b, 10 synapses, 2 boutons; 1s, 4 synapses, 2 boutons). The estimated CV is presented for each bouton type at the top of the corresponding bar.
Fig. 3.
Fig. 3.
The 1s boutons contain larger vesicles than 1b boutons, and dlgm52 mutants contain larger vesicles than controls. Electron micrographs show vesicles contained within 1b and 1s boutons in CS (1b, 198 vesicles; 1s, 254 vesicles), dlgm52 (1b, 215 vesicles; 1s, 247 vesicles), and dlg res. larvae (1b, 319 vesicles; 1s, 325 vesicles). Synaptic vesicles are larger on average in 1s boutons for all cases. Scale bar (for all micrographs), 0.1 μm.
Fig. 4.
Fig. 4.
Separation of quantal events recorded for 1s control bouton into signals and contaminants. a, String of 1b and 1s boutons viewed under DiOC2(5) fluorescence (left). The macropatch electrode is placed on the muscle surface to enclose the 1s bouton from which mEJCs were recorded, seen under Nomarski optics (right). The circlerepresents the 1s bouton from which recordings were made. Scale bar, 4 μm. b, Distribution of observations separated into signals (open circles) and contaminants (filled circles). Simultaneous records of quantal currents and their respective potentials were plotted, and contaminants were identified as described in Materials and Methods, usingPs = 0.5 as a cutoff for statistical definition. Inset, Representative mEJCs (top traces) and simultaneously recorded mEJPs (bottom traces). Vertical calibration, 0.4 mV for mEJCs and 3.0 mV for mEJPs; horizontal calibration, 10 msec. c, Angular distribution of the points shown in b. Signals (open bars) reside at shallower angles (66 ± 0.9°; n = 63) than contaminants (filled bars; 86.5 ± 0.2°,n = 57). d, Amplitude–frequency distribution of mEJCs separated into signals (open bars; 0.49 ± 0.04 mV; n = 63) and contaminants (filled bars; 0.09 ± 0.0 mV;n = 57). The distribution of signal amplitudes is skewed toward larger values. Frequency of occurrence of signals is lower after (0.046/sec) than before (0.087/sec) the separation of contaminants. e, Amplitude–frequency distribution of mEJPs belonging to the signal group (mean, 1.20 ± 0.010 mV;n = 63). f, Plot of the rise times versus mEJC amplitudes for both signals (open circles) and contaminants (filled circles). Contaminants are smaller in amplitude and possess longer rise times than signals.Inset, The percentage of cumulative frequency distribution of mEJC rise times belonging to signals (solid line; mean 0.89 ± 0.03 msec; n = 63) and contaminants (dotted line; mean, 1.30 ± 0.07 msec; n = 57). The K–S test indicates that the two distributions are significantly different; rise times of contaminants are slower than those of signals.
Fig. 5.
Fig. 5.
Quantal size differs with input and phenotype, whereas variance is similar for all cases. a, Summary of the mean signal mEJC amplitude parameters from the five types of bouton that were investigated (1b, n = 10; 1sn = 11; dlg 1s,n = 10; dlg 1s res.,n = 8; lap 1b, n= 7). A one-way ANOVA test revealed significant differences among the groups (p < 0.0001). Pairwise comparisons of signals via a Student's t test revealed significant differences in mean mEJC amplitudes between 1b and 1s boutons (p = 0.020), 1b and dlg 1s boutons (p < 0.001), 1s anddlg 1s boutons (p = 0.021), 1b and dlg 1s res. (p = 0.030), 1b and lap 1b (p < 0.001), 1s and lap 1b (p = 0.014), 1b and dlg 1s res. (p= 0.030), and dlg 1s res. and lap 1b (p = 0.0016). There was no significant difference between 1s and dlg 1s res. (p = 0.49) and dlg 1s andlap 1b (p = 0.73).b, The quantal variance of the mEJCs (CVmEJC). A one-way ANOVA test revealed no significant difference among the five bouton types (p = 0.44). For all graphs, error bars indicate SEM.
Fig. 6.
Fig. 6.
Quantal variance matched to variations in synaptic area and vesicle volume (inner and outer). Shown is a comparison of the amplitude distribution of mEJCs with the synaptic areas for 1b and 1s boutons (a, b) and with the distribution of the vesicle volumes for 1b, 1s, dlg 1s, anddlg res. 1s boutons (c–f).a, b, The standardized distributions of mEJC amplitudes (solid lines) pooled from all experiments (1b, 423 events, 10 experiments; 1s, 484 events, 11 experiments) compared with the standardized distribution of synaptic areas (gray line) for 1b boutons (a; n = 129) and 1s boutons (b; n = 61). The distributions were significantly different (K–S test) for 1s boutons, but not for 1b boutons. c–f, The standardized distributions of mEJC amplitudes (solid lines) pooled from all experiments (1b, 423 events, 10 experiments; 1s, 484 events, 11 experiments;dlg 1s, 376 events, 10 experiments; dlg1s res., 687 events, 8 experiments) compared with the standardized distribution of outer (gray lines) and inner (broken lines) vesicle volumes for each bouton type (1b, 198 vesicles; 1s, 254 vesicles; dlg 1s, 247 vesicles;dlg 1s res., 325 vesicles). The mEJC and vesicle volume distributions were not significantly different for any bouton type (K–S test).
Fig. 7.
Fig. 7.
A plot of mean quantal amplitude against the mean outer (a) and inner (b) vesicle volumes (calculated from both outer and inner vesicle diameters, respectively) for five bouton types. A linear fit is applied to the data points (uncorrected outer volumes: p = 0.0031, r = 0.98, slope = 0.01 mV/zL,filledcircles; corrected outer volumes:p = 0.0057, r = 0.96, slope = 0.008 mV/zL, open circles; uncorrected inner volumes: p = 0.043, r = 0.86, slope = 0.041 mV/zL, filled squares; corrected inner volumes: p = 0.033,r = 0.88, slope = 0.035 mV/zL, open squares). The constant slopes imply that the concentration of transmitter is the same for all vesicles.

Similar articles

Cited by

References

    1. Aoki C, Miko I, Oviedo H, Mikeladze-Dvali T, Alexandre L, Sweeney N, Bredt DS. Electron microscopic immunocytochemical detection of PSD-95, PSD-93, SAP-102, and SAP-97 at postsynaptic, presynaptic, and nonsynaptic sites of adult and neonatal rat visual cortex. Synapse. 2001;40:239–257. - PubMed
    1. Atwood HL, Tse FW. Physiological aspects of presynaptic inhibition. Adv Neural Sci. 1993;1:19–65.
    1. Atwood HL, Govind CK, Wu C-F. Differential ultrastructure of synaptic terminals on ventral longitudinal abdominal muscles in Drosophila larvae. J Neurobiol. 1993;24:1008–1024. - PubMed
    1. Atwood HL, Karunanithi S, Georgiou J, Charlton MP. Strength of synaptic transmission at neuromuscular junctions of crustaceans and insects in relation to calcium entry. Invert Neurosci. 1997;3:81–87. - PubMed
    1. Atwood HL, Karunanithi S, Wong K, Marin L, Stewart BA. Determinants of quantal size at Drosophila synapses: bouton type, vesicle size, and the size of the postsynaptic receptor patch. Soc Neurosci Abstr. 1999;25:187.11.

Publication types

MeSH terms