Regulation by glycogen synthase kinase-3beta of the arborization field and maturation of retinotectal projection in zebrafish
- PMID: 12451132
- PMCID: PMC6758727
- DOI: 10.1523/JNEUROSCI.22-23-10324.2002
Regulation by glycogen synthase kinase-3beta of the arborization field and maturation of retinotectal projection in zebrafish
Abstract
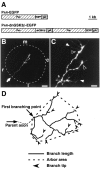
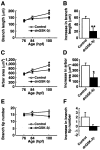
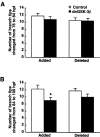
The retinotectal projection is one of the best systems to study the molecular basis of synapse formation in the CNS because of the well characterized topographic connections and activity-dependent refinement. Here, we developed a presynaptic neuron-specific gene manipulation system in the zebrafish retinotectal projection in vivo using the nicotinic acetylcholine receptor beta3 (nAChRbeta3) gene promoter. Enhanced green fluorescent protein (EGFP) expression signals in living transgenic zebrafish lines carrying the nAChRbeta3 gene promoter-directed EGFP expression vector visualized the development of entire retinal ganglion cell (RGC) axon projection to the tectum. Microinjection of the nAChRbeta3 gene promoter-driven double-cassette vectors directing the expression of both dominant-negative glycogen synthase kinase-3beta (dnGSK-3beta) and EGFP enabled us to follow the development of individual RGCs and to examine the effect of the molecule on the axonal arborization and maturation of the same neurons in living zebrafish. We found that the expression of the dominant-negative form of zebrafish GSK-3beta suppressed the arborization field of RGC axon terminals in the tectum as estimated by the reduction of arbor branch length and arbor areas. Furthermore, the suppression of GSK-3beta activity increased the size of vesicle-associated membrane protein 2-EGFP puncta in RGC axon terminals at the early stage of innervation to the tectum. These results suggest that GSK-3beta regulates the arborization field and maturation of RGC axon terminals in vivo.
Figures


Similar articles
-
Cell-autonomous TrkB signaling in presynaptic retinal ganglion cells mediates axon arbor growth and synapse maturation during the establishment of retinotectal synaptic connectivity.J Neurosci. 2007 Mar 7;27(10):2444-56. doi: 10.1523/JNEUROSCI.4434-06.2007. J Neurosci. 2007. PMID: 17344382 Free PMC article.
-
Neuron-specific gene manipulations to transparent zebrafish embryos.Methods Cell Sci. 2003;25(1-2):15-23. doi: 10.1023/B:MICS.0000006850.81427.ed. Methods Cell Sci. 2003. PMID: 14739583
-
Presynaptic protein kinase C controls maturation and branch dynamics of developing retinotectal arbors: possible role in activity-driven sharpening.J Neurobiol. 2004 Feb 15;58(3):328-40. doi: 10.1002/neu.10286. J Neurobiol. 2004. PMID: 14750146
-
Connecting the eye with the brain: the formation of the retinotectal pathway.Results Probl Cell Differ. 2000;31:157-77. doi: 10.1007/978-3-540-46826-4_9. Results Probl Cell Differ. 2000. PMID: 10929406 Review. No abstract available.
-
Development of the visual system of the chick. II. Mechanisms of axonal guidance.Brain Res Brain Res Rev. 2001 Jul;35(3):205-45. doi: 10.1016/s0165-0173(01)00049-2. Brain Res Brain Res Rev. 2001. PMID: 11423155 Review.
Cited by
-
Distinct roles of calcineurin-nuclear factor of activated T-cells and protein kinase A-cAMP response element-binding protein signaling in presynaptic differentiation.J Neurosci. 2005 Mar 23;25(12):3067-79. doi: 10.1523/JNEUROSCI.3738-04.2005. J Neurosci. 2005. PMID: 15788763 Free PMC article.
-
Cell-autonomous TrkB signaling in presynaptic retinal ganglion cells mediates axon arbor growth and synapse maturation during the establishment of retinotectal synaptic connectivity.J Neurosci. 2007 Mar 7;27(10):2444-56. doi: 10.1523/JNEUROSCI.4434-06.2007. J Neurosci. 2007. PMID: 17344382 Free PMC article.
-
GSK-3 beta inhibits presynaptic vesicle exocytosis by phosphorylating P/Q-type calcium channel and interrupting SNARE complex formation.J Neurosci. 2010 Mar 10;30(10):3624-33. doi: 10.1523/JNEUROSCI.5223-09.2010. J Neurosci. 2010. PMID: 20219996 Free PMC article.
-
The Acquisition of Target Dependence by Developing Rat Retinal Ganglion Cells.eNeuro. 2015 Jul 10;2(3):ENEURO.0044-14.2015. doi: 10.1523/ENEURO.0044-14.2015. eCollection 2015 May-Jun. eNeuro. 2015. PMID: 26464991 Free PMC article.
-
A TrkB/EphrinA interaction controls retinal axon branching and synaptogenesis.J Neurosci. 2008 Nov 26;28(48):12700-12. doi: 10.1523/JNEUROSCI.1915-08.2008. J Neurosci. 2008. PMID: 19036963 Free PMC article.
References
-
- Ahmari SE, Buchanan J, Smith SJ. Assembly of presynaptic active zones from cytoplasmic transport packets. Nat Neurosci. 2000;3:445–451. - PubMed
-
- Alsina B, Vu T, Cohen-Cory S. Visualizing synapse formation in arborizing optic axons in vivo: dynamics and modulation by BDNF. Nat Neurosci. 2001;4:1093–1101. - PubMed
-
- Ayaso E, Nolan CM, Byrnes L. Zebrafish insulin-like growth factor-I receptor: molecular cloning and developmental expression. Mol Cell Endocrinol. 2002;191:137–148. - PubMed
-
- Burrill JD, Easter SS., Jr Development of the retinofugal projections in the embryonic and larval zebrafish (Brachydanio rerio). J Comp Neurol. 1994;346:583–600. - PubMed
-
- Cantallops I, Haas K, Cline HT. Postsynaptic CPG15 promotes synaptic maturation and presynaptic axon arbor elaboration in vivo. Nat Neurosci. 2000;3:1004–1011. - PubMed
Publication types
MeSH terms
Substances
Associated data
- Actions
LinkOut - more resources
Full Text Sources
Molecular Biology Databases
