. 2002 Dec 1;22(23):10388-98.
doi: 10.1523/JNEUROSCI.22-23-10388.2002.

Basis of changes in left-right coordination of rhythmic motor activity during development in the rat spinal cord

Affiliations

Basis of changes in left-right coordination of rhythmic motor activity during development in the rat spinal cord

Kiyomi Nakayama et al. J Neurosci. .

Abstract

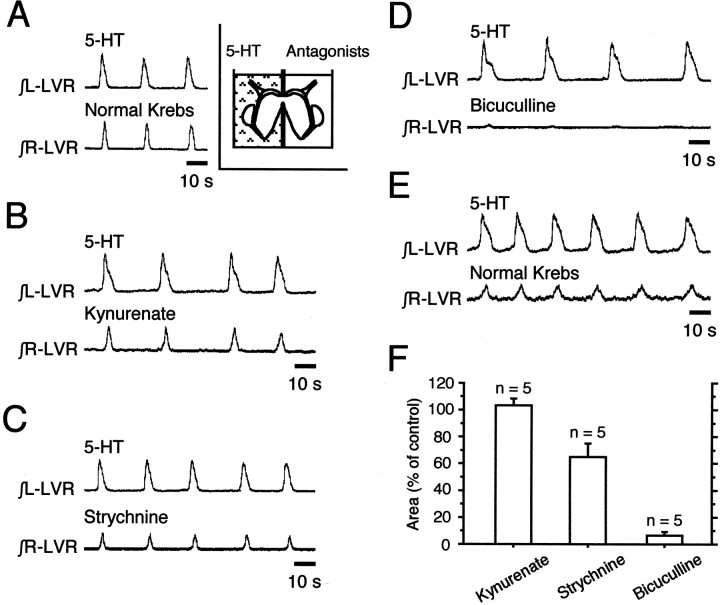
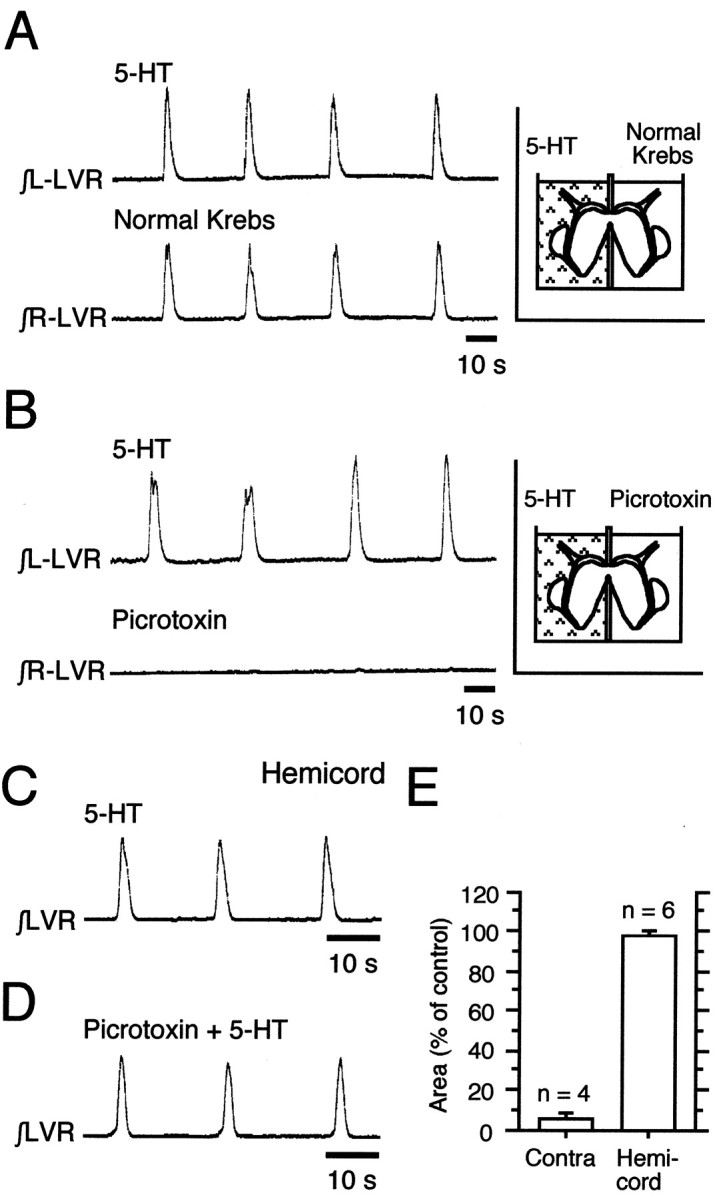
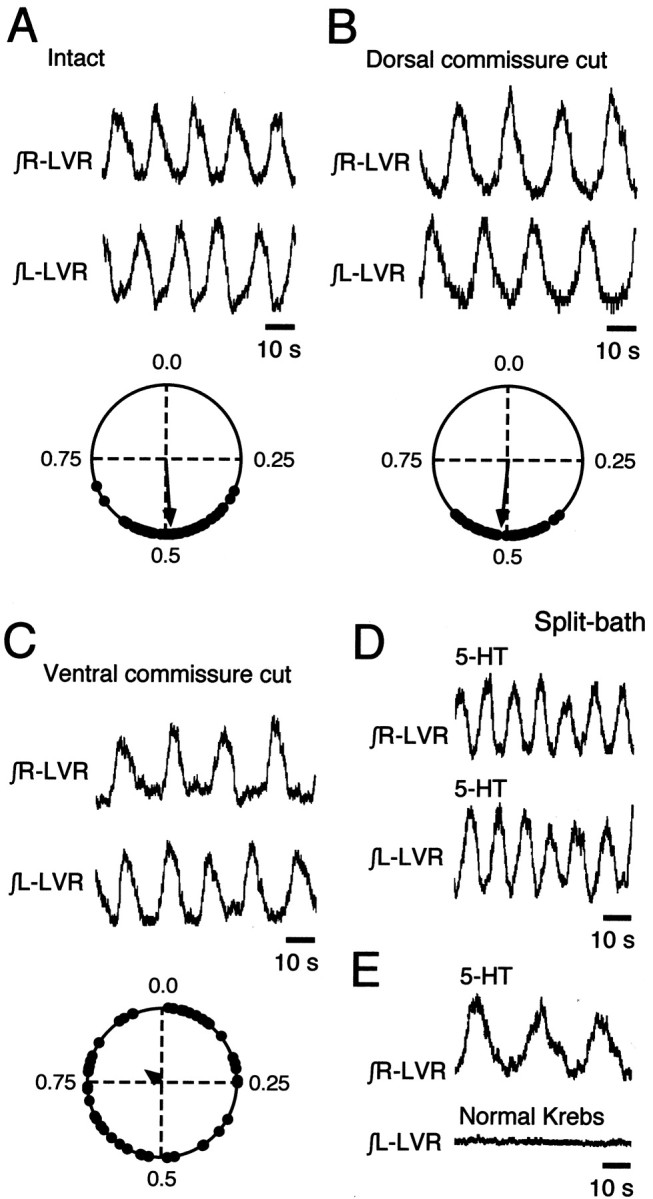
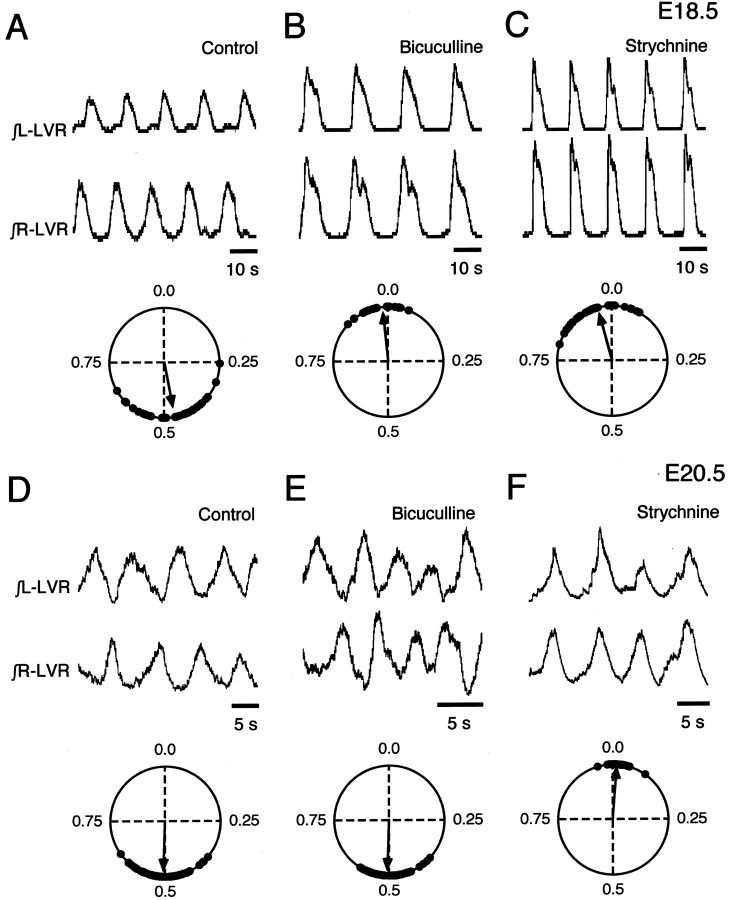
The basic neuronal networks generating coordinated rhythmic motor activity, such as left-right alternate limb movement during locomotion in mammals, are located in the spinal cord. In rat fetuses, the spatial pattern of the rhythmic activity between the left and right sides is synchronous at and shortly after rhythmogenesis before the pattern becomes alternate by birth. The neuronal mechanisms underlying these developmental changes in the left-right coordination were examined in isolated spinal cord preparations. Calcium imaging of commissural neurons at the early fetal stages revealed that the intracellular Ca2+ concentration of the commissural neurons was elevated by bath-application of 5-hydroxytryptamine (5-HT) in synchrony with the simultaneously recorded rhythmic activity of the ventral root, suggesting that the commissural neurons mediate the left-right coordination of the rhythmic activity from onset of the rhythmogenesis. Using a longitudinal split-bath setup, we show that the synchronicity in pattern of the rhythmic activity is the result of excitatory connections being formed via commissural neurons between the rhythm-generating networks located in the left and right spinal cord. During this period, such connections were found to be mediated by excitatory synaptic transmission via GABA(A) receptors. When the pattern of rhythmic activity became left-right alternate at later fetal stages, these connections, still via GABA(A) receptors, were mediating reciprocal inhibition between the two sides. Nearer birth, glycine receptors took over this role. Our results reveal the nature of the neuronal mechanisms forming the basis of the left-right coordination of rhythmic motor activity during prenatal development.


Figures

Fig. 1.
Fig. 1.
Pattern of rhythmic activity induced by 5-HT in left and right lumbar ventral roots of fetal rat spinal cord. Nerve discharges recorded simultaneously from the left and right lumbar ventral roots (top traces) and their integrals (bottom traces) at E16.5 (A) and E20.5 (B) are shown. The rhythmic activity was induced by 1 μm 5-HT at E16.5 and by 20 μm5-HT at E20.5. The pattern of the 5-HT-induced rhythmic activity was the same at all concentrations (1–30 μm) examined.
Fig. 2.
Fig. 2.
Effects of lesions of dorsal and ventral commissures on 5-HT-induced rhythmic activity at E15.5.A, Schematic drawing of the lesion of the dorsal commissure (top arrow) and ventral commissure (bottom arrow). B, Ventral root discharges induced by 1 μm 5-HT before (top traces) and after (bottom traces) lesion of the dorsal commissure in a single preparation. C, Ventral root discharges induced by 1 μm 5-HT before (top traces) and after (bottom traces) lesion of the ventral commissure in a single preparation. B,C, Right panels show phase lags between the left and right sides. The circular plot is based on 10 phase values from each preparation. Data from five tested preparations were pooled and displayed as the left–right circular phase diagram. There were no significant differences among the five preparations.
Fig. 3.
Fig. 3.
Commissural neurons retrogradely labeled with DiI.A–D, Fluorescent light-microscope photographs taken from transverse sections of the lumbar spinal cord at E15.5.A, Cell bodies of commissural neurons were labeled on the side (left) contralateral to the DiI-injected side (right). B–D, Commissural neurons located in the medial (B) and lateral (C) parts of the intermediate zone and in the medial part of the ventral horn (D) are shown.Arrowheads and arrows show, respectively, cell bodies of commissural neurons and axons crossing to the contralateral side. E, The dye-injection site is shown in the horizontal plane (top) and in the transverse plane (bottom). To label only the commissural neurons crossing the ventral commissure, the dorsal commissure was cut. To prevent nonspecific diffusion of DiI, one segment was cut away on the contralateral side before placement of DiI. Crystals of DiI were placed in the hatched area. F, Location of all the labeled commissural neurons in a preparation at E16.5. Cell bodies are shown byopen circles in the transverse plane. Scale bars:A–D,F, 100 μm.
Fig. 4.
Fig. 4.
Calcium imaging of commissural neurons.A, Schematic drawing of injection site for Calcium Green-1 AM. The arrow indicates retrograde labeling of contralateral commissural neurons. B, Location of commissural neurons labeled by Calcium Green-1 AM at E16.5. The locations of cell bodies were plotted from transverse sections of a preparation after a 10 hr incubation (n = 3).C, Scheme of the experimental setup for calcium imaging and simultaneous ventral root recording. The spinal cord was put in a chamber with the rostral cut surface down. D, Low-power image of Calcium Green-labeled commissural neurons in transected surface after a 10 hr incubation after dye injection at E16.5. The neurons within the box are shown at higher magnification (40× objective) in E. F, Fluorescence change (ΔF/F) in the three neurons indicated bycircles in E. Rhythmic elevations in fluorescence intensity were induced by application of 1 μm 5-HT (as shown by the bar). Thebottommost trace shows integrated ventral root discharges (recorded simultaneously). During such rhythmic elevations in fluorescence intensity, the peak amplitude rose by 24.8 ± 0.9% compared with the baseline fluorescence intensity (174 cells, 7 preparations), and the mean duration of a single elevation was 11.2 ± 0.2 sec (174 cells, 7 preparations).
Fig. 5.
Fig. 5.
Rhythmic activity induced in contralateral ventral root by excitation of the rhythm-generating network or commissural neurons on one side of E15.5 spinal cord. A, Scheme of the longitudinal split-bath setup. The chamber was separated into left and right parts, with the only connection via the ventral commissure of the spinal cord. B, Integrated recording of the rhythmic activity induced by perfusion with 1 μm 5-HT on both sides (top) or on one side (the left) (bottom) in the longitudinal split-bath setup.C, Effects of perfusion of Ca2+-free Krebs' solution on the 5-HT-free side (top) and on the 5-HT-applied side (bottom). D, Effect of application of muscimol to the commissural neurons examined using calcium imaging. The commissural neurons were labeled with Calcium Green-1 AM as shown in Figure 4. The fluorescence intensity was elevated by application of 100 μm muscimol in the presence of 1 μm TTX. E, Activity in the left and right ventral roots during application of 100 μmmuscimol to the side also exposed to Ca2+-free Krebs' solution (as shown in the schematic drawing in theinset).
Fig. 6.
Fig. 6.
Neurotransmitters mediating inputs from the rhythm-generating network on one side to the opposite side of the spinal cord during the early fetal period. A, Left and right ventral root discharges induced by application of 1 μm 5-HT to left side of the spinal cord at E15.5. Synchronous rhythmic activity is observed on the two sides [5-HT-free side (bottom trace); 5-HT-applied side (top trace)]. Inset shows a schematic drawing indicating the 5-HT-applied side and the side treated either with normal Krebs' (A, E) or with antagonists (B–D). B–D, Effects of application of antagonists, 4 mm kynurenate (B), 5 μm strychnine (C), and 10 μm bicuculline (D), to the 5-HT-free side (bottom trace) in the same preparation as in A.E, The discharges recorded after washout of antagonists.F, Changes in area of integrated ventral root discharges on the 5-HT-free side induced by application of antagonists to that side at E15.5. For the purposes of F, the responses on the 5-HT-free side of the cord recorded before any application of antagonists (A) were taken as the “control” responses (100%).
Fig. 7.
Fig. 7.
Effect of picrotoxin on rhythm-generating networks. A, B, Effects of application of 20 μm picrotoxin on the 5-HT-free side (B) in the longitudinal split-bath setup and the control (A) at E15.5. C,D, Effects of application of 20 μmpicrotoxin on 5-HT-induced rhythmic activity in the hemicord at E15.5.E, Change in area of integrated ventral root discharges on the 5-HT-free side induced by application of picrotoxin to that side (Contra) and change in that on the 5-HT-induced rhythmic activity in the hemicord. The responses recorded before application of picrotoxin were taken as “control” responses (100%).
Fig. 8.
Fig. 8.
Connection mediating alternating rhythmic activity between left and right spinal cord during the late fetal period.A–C, Effects of lesion of the dorsal commissure (B) or ventral commissure (C) on the 5-HT-induced rhythmic activity (A) at E20.5. The rhythmic activity was induced by 20 μm 5-HT. AC,Bottom panels show phase lags between the left and right sides. The circular plot is based on 10 phase values from each preparation. Data from five tested preparations were pooled and displayed as the left–right circular phase diagram. There were no significant differences among the five preparations. D,E, 5-HT-induced discharges in the longitudinal split-bath setup at E20.5. Shown are the effects of application of 20 μm 5-HT on both sides (D) or on one side (the right) (top trace) (E) in the same preparation.
Fig. 9.
Fig. 9.
Neurotransmitters mediating reciprocal inhibition during left and right alternation at late fetal stages.A–C, Effects of application of 10 μmbicuculline (B) or 5 μm strychnine (C) on the ventral root discharges (A) induced by 20 μm 5-HT at E18.5.D–F, Effects of application of 10 μmbicuculline (E) or 5 μm strychnine (F) on the ventral root discharges (D) induced by 20 μm 5-HT at E20.5.Bottom panels show phase lags between the left and right sides. The circular plot is based on 10 phase values from each preparation. Data from five tested preparations were pooled and displayed as the left–right circular phase diagram. For the circular plot expressing effects of bicuculline at E20.5, results of five preparations in which the pattern was not changed by bicuculline were used. There were no significant differences among the five preparations.

Similar articles

Cited by

References

    1. Batschelet E. Circular statistics in biology (Sibson R, Cohen JE, eds). Academic; New York: 1981.
    1. Ben-Ari Y, Cherubini E, Corradetti R, Gaiarsa JL. Giant synaptic potentials in immature rat CA3 hippocampal neurones. J Physiol (Lond) 1989;416:303–325. - PMC - PubMed
    1. Buchanan JT. Identification of interneurons with contralateral, caudal axons in the lamprey spinal cord: synaptic interactions and morphology. J Neurophysiol. 1982;47:961–975. - PubMed
    1. Buchanan JT, Cohen AH. Activities of identified interneurons, motoneurons, and muscle fibers during fictive swimming in the lamprey and effects of reticulospinal and dorsal cell stimulation. J Neurophysiol. 1982;47:948–960. - PubMed
    1. Cazalets JR, Sqalli-Houssaini Y, Clarac F. Activation of the central pattern generators for locomotion by serotonin and excitatory amino acids in neonatal rat. J Physiol (Lond) 1992;455:187–204. - PMC - PubMed

Publication types

MeSH terms